How do we know if a CME is Earth directed and when it's going to arrive?
When a solar flare or filament eruption occurs then we do not know immediately if it launched a coronal mass ejection (CME). Even if a coronal mass ejection erupted into space, there are no guarantees that it is aimed towards Earth. In this article we will show you the methods that you can use to determine if a coronal mass ejection erupted from the Sun, if it is aimed towards Earth and when it might arrive.
1. Using the proton flux monitor
On our website you’ll find a data plot showing the amount of ≥10 MeV solar protons measured near Earth. During huge explosions on the Sun a solar radiation storm can be triggered. Solar protons get blown into space and can travel at speeds near the speed of light in extreme events. They are the first particles to arrive at Earth so a solar radiation storm can develop very quickly following a major event on the Sun. These solar protons are a good indicator that there was an eruptive solar event that likely launched a coronal mass ejection into space. While we can be pretty confident that a coronal mass ejection was launched into space, this is not the ideal way to determine if the coronal mass ejection is Earth-directed as these particles tend to follow the interplanetary magnetic field: the Parker spiral. It has happened that we saw a solar radiation storm at Earth even though the associated coronal mass ejection did not have an Earth-directed component. This often occurs during events near the western limb but in rare cases, even protons from major far side solar events have reached our planet.
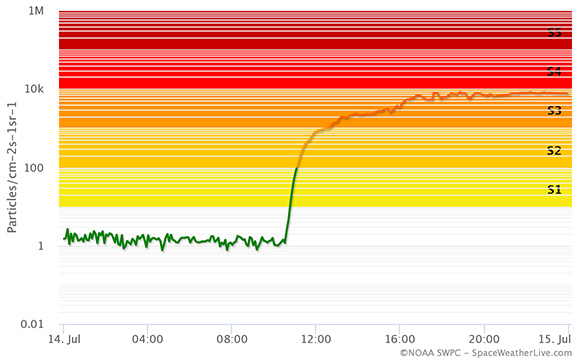
Image: An example of the ≥10 MeV solar protons plot that you can find on our website. This plot shows the ≥10 MeV solar proton flux near Earth on 14 July 2000 when A major X5.7 solar flare took place. We see a sharp increase in the amount of ≥10 MeV solar protons starting at 10:35 UTC, only 32 minutes after the solar flare started. A strong S3 solar radiation storm quickly developed.
2. Using SOHO/LASCO coronagraph imagery
The best way to be sure that a coronal mass ejection is Earth-directed is with the help of images taken by the LASCO C2 and C3 coronagraph instruments which are located on the SOHO (Solar and Heliospheric Observatory) spacecraft. SOHO watches the Sun from Earth’s perspective so potential Earth-directed coronal mass ejections can easily be identified. Coronal mass ejections that are Earth-directed will show up as partial or full halo coronal mass ejections as they propagate away from the Sun. Keep in mind that the images from SOHO are not always in real-time and you often have to wait several hours for new imagery and thus it can often take a while before we know for sure if a coronal mass ejection has an Earth-directed component or not.
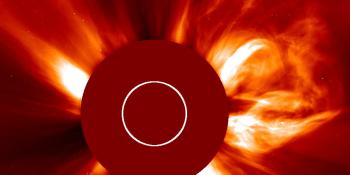
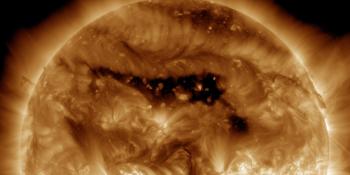
Below we have two great examples of how a coronal mass ejection could look like on the images coming from the SOHO/LASCO instrument package. The animation on the left shows a coronal mass ejection as seen by the SOHO/LASCO C2 instrument which is heading towards the north and did not impact Earth. There is no halo outline so we can easily conclude that this plasma cloud isn’t aimed at Earth. On the right however we see a full halo coronal mass ejection as seen by SOHO/LASCO C2. The outline of this coronal mass ejection forms a perfect circle engulfing LASCO’s entire field of view. This means one of two things: the plasma cloud is aimed straight towards or away from us.
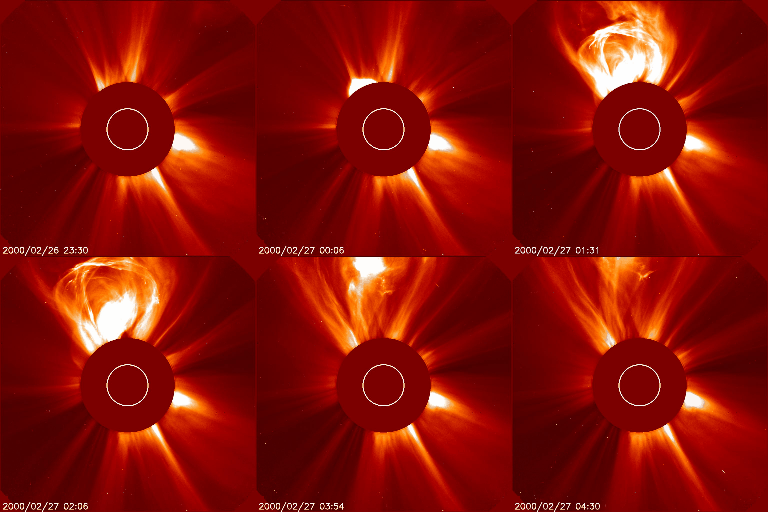
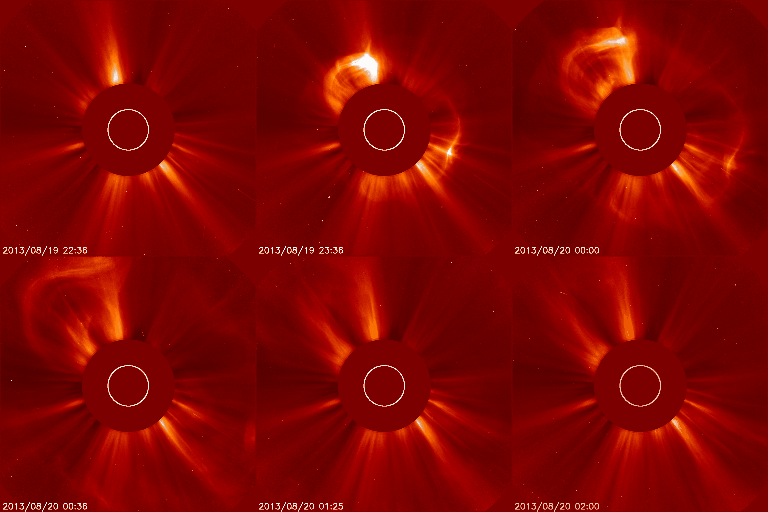
If we are unsure if a coronal mass ejection detected in LASCO imagery comes from the Earth-facing solar disk perhaps due to no clear signs of an eruption, we can look at the images made by the STEREO (Solar TErrestrial RElations Observatory) mission. The STEREO mission consists of two spacecraft which are named STEREO Ahead & STEREO Behind. They are watching the farside of the Sun. The imagery of STEREO and SOHO combined will give us a 3D representation of the coronal mass ejection and tell us if the coronal mass ejection is coming towards Earth or traveling away from Earth. Imagery from both the SOHO and STEREO missions can be found on the website.
By using the all of the imagery available from the SOHO and STEREO missions, the space weather scientists can calculate the departure speed and set an Estimated Time of Arrival (ETA) for the coronal mass ejection. After they are finished with their reports you can look on our site and look at the solar wind models and the daily reports from the NOAA SWPC to see when the coronal mass ejection is expected to arrive. The SpaceWeatherLive team will also provide an analysis during major events.
3. Using the SIDC Cactus Software
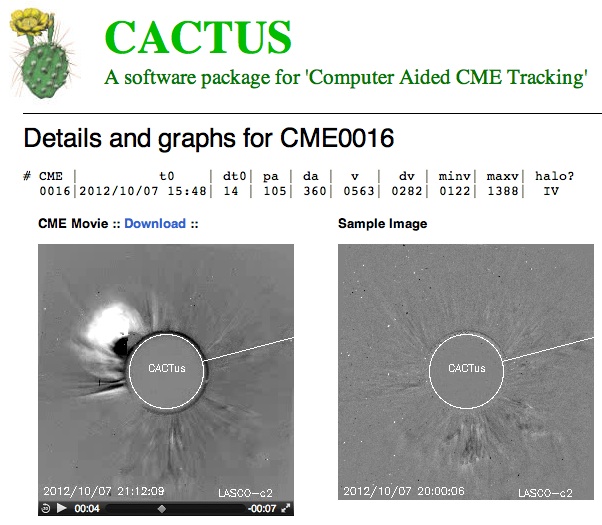
The Belgian Solar Influences Data Analysis Center (SIDC) developed the CACTUS program which stands for Computer Aided CME Tracking. It automatically scans imagery from SOHO/LASCO to determine whether a coronal mass ejection is likely to hit Earth or not. It will show if a coronal mass ejection is a halo coronal mass ejection or partial halo coronal mass ejection and also determines the lift off speed of the coronal mass ejection which will make it possible to determine when the coronal mass ejection could arrive.
4. Using the EPAM Plot
EPAM stands for the Electron, Proton and Alpha Monitor and is an instrument on the ACE satellite that measures the electrons and protons that are send out with the solar wind. It’s a very useful instrument to know if a coronal mass ejection is Earth directed and when it’s going to arrive. We’ll be making it a bit clear with some EPAM plots. Below you can find an EPAM plot as it can look like a few hours after a solar flare.
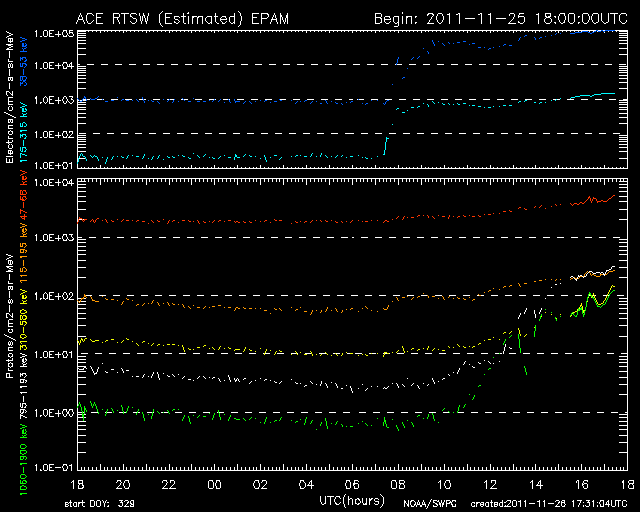
When a huge explosion occurs on the Sun, electrons and protons are hurled away from the Sun into space. The electrons and protons are pushed out with the solar wind flow. Immediately following an event that launched a coronal mass ejection, the EPAM plot will show a rise in the low-energy electrons which marks the start of the flare. The low-energy proton plot will also show a steady rise. This often indicates that a part of the coronal mass ejection is Earth-directed. If we put everything together and we know that a coronal mass ejection is on it’s way to Earth… one critical question remains: when is the coronal mass ejection going to arrive?
When does the CME arrive?
Once we know the speed of the coronal mass ejection, we can determine ourselves when it might arrive. With the following table you can determine how long the coronal mass ejection will take to travel from the Sun to Earth providing it does not slow down along the way. The times listed below are thus only a guide. It is common for coronal mass ejections to arrive earlier or later than the predicted arrival time with a margin of sometimes 6 hours or more!
| CME speed (km/s) | Travel time (hours) | Days | Hours |
|---|---|---|---|
| 300 | 138,88 | 5 | 18.88 |
| 400 | 104,16 | 4 | 8,16 |
| 500 | 83.33 | 3 | 11.33 |
| 600 | 69.44 | 2 | 21.44 |
| 700 | 59.52 | 2 | 11.52 |
| 800 | 52.08 | 2 | 4.08 |
| 900 | 46.30 | 1 | 22.30 |
| 1000 | 41.67 | 1 | 17.67 |
| 1100 | 37.88 | 1 | 13.88 |
| 1200 | 34.72 | 1 | 10.72 |
| 1300 | 32.05 | 1 | 8.05 |
| 1400 | 29.76 | 1 | 5.76 |
| 1500 | 27.78 | 1 | 3.78 |
| 1600 | 26.04 | 1 | 2.04 |
| 1700 | 24.51 | 1 | 0.51 |
| 1800 | 23.15 | 0 | 23.15 |
| 1900 | 21.93 | 0 | 21.93 |
| 2000 | 20.83 | 0 | 20.83 |
| 2100 | 19.84 | 0 | 19.84 |
| 2200 | 18.94 | 0 | 18.94 |
Determine the impact by using the EPAM monitor
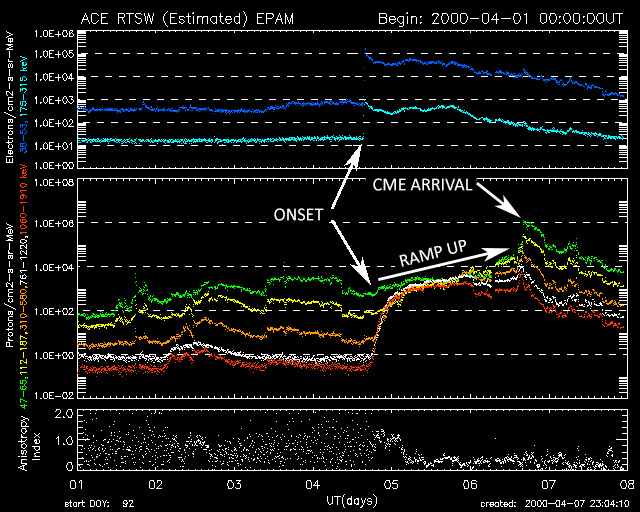
Once a coronal mass ejection has been launched and we determined it is Earth-directed, the only thing we can do is wait and watch the EPAM plot. Most coronal mass ejections form a shock ahead of the plasma cloud itself and this accelerates protons that we can measure with the help of the EPAM instrument on ACE. We will see how the proton plot keeps rising until the arrival of the coronal mass ejection. The first rise in the plot (just after a solar flare) is called the “onset” phase. It keeps rising slowly (ramp up phase) as the coronal mass ejection gets closer. A few hours before the actual arrival of the coronal mass ejection a new sharper rise takes place, this indicate that the coronal mass ejection is going to arrive soon. When the EPAM plot peaks, then it indicates that the coronal mass ejection has arrived at the DSCOVR satellite. The solar wind and interplanetary magnetic field data should now clearly show that the coronal mass ejection has arrived. After the coronal mass ejection arrival you will see that the proton levels will slowly decline to normal values… unless there is another coronal mass ejection on it’s way to Earth of course. The image below shows an example of the EPAM plot where you can clearly see the different phases. Note that slow and weaker coronal mass ejections sometimes do not push a shock wave in front of them. These are much harder or impossible to pick out on EPAM!
Latest news
Latest forum messages
Support SpaceWeatherLive.com!
A lot of people come to SpaceWeatherLive to follow the Sun's activity or if there is aurora to be seen, but with more traffic comes higher server costs. Consider a donation if you enjoy SpaceWeatherLive so we can keep the website online!

Space weather facts
| Last X-flare | 2024/12/08 | X2.2 |
| Last M-flare | 2024/12/22 | M1.0 |
| Last geomagnetic storm | 2024/12/17 | Kp5+ (G1) |
| Spotless days | |
|---|---|
| Last spotless day | 2022/06/08 |
| Monthly mean Sunspot Number | |
|---|---|
| November 2024 | 152.5 -13.9 |
| December 2024 | 103.3 -49.2 |
| Last 30 days | 115.4 -40.8 |

