Coronal hole stream onset, G1 geomagnetic storm
Wednesday, 15 April 2015 18:10 UTC

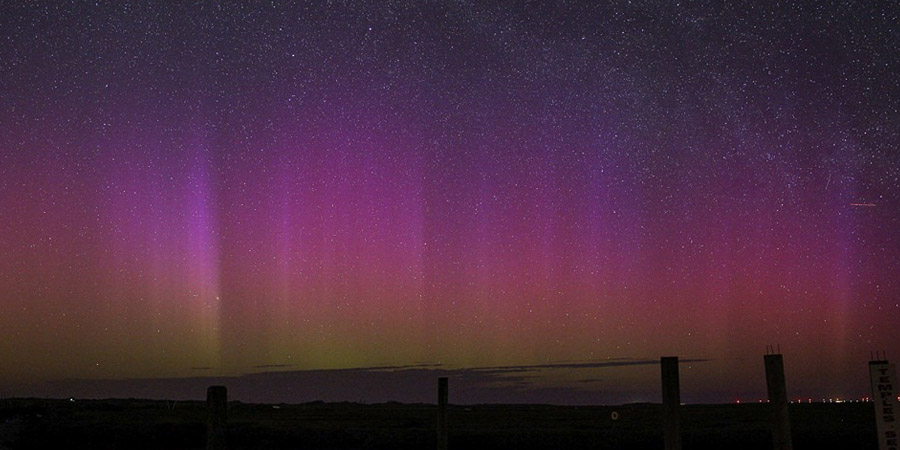
Auroral activity has reached the minor G1 geomagnetic storm threshold during the past 24 hours thanks to a coronal hole high speed solar wind stream. The direction of the IMF (Bz) is pointing southward most of the time and this is causing enhanced auroral displays at high latitude locations. Auroral displays have been visible from many locations all over the world and in the northern hemisphere it was even seen as far south as Norfolk, England (!) where James Rowley-Hill took this amazing image that serves as our header. Fantastic!
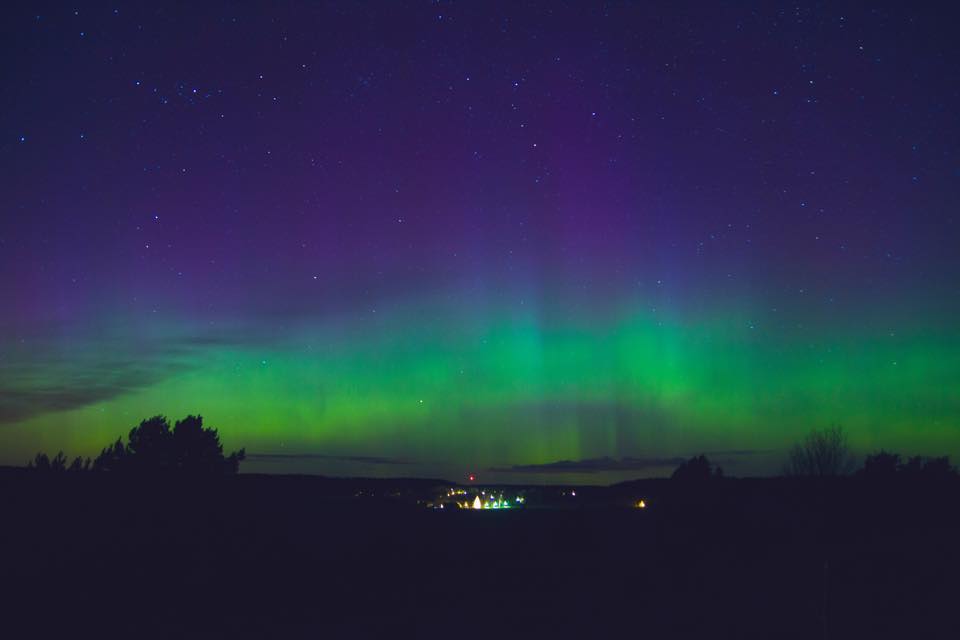
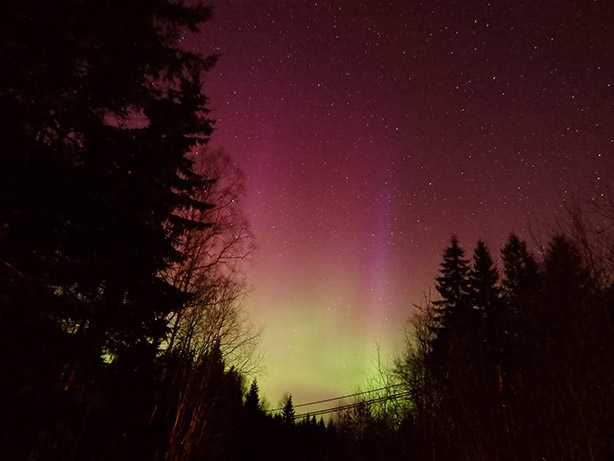
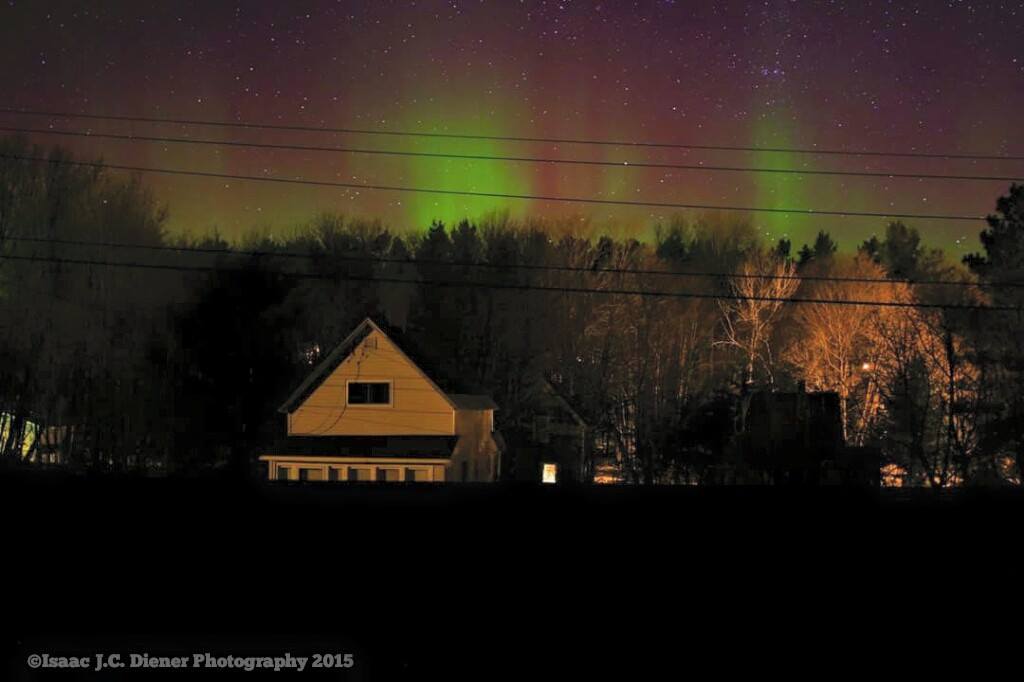
Below you can find more stunning auroral images captured around the world during the past 24 hours:

Nathalie Åkerlind (Torstuna, Uppsala Län, Sweden)

Jüri Voit Photography (Estonia)

Jörgen Norrland Andersson (Gävleborgs Län, Sweden)

Sophie Fazackerley (Howden, Tasmania, Australia)

Isaac Diener (Painesdale, MI, USA)
The speed of the solar wind has now increased to over 600km/s but the strength of the IMF has diminished along with the solar wind density. These are classic signs of a solar wind stream flowing from a coronal hole. More periods of active (Kp4) to minor G1 geomagnetic storming (Kp5) conditions remain capable in the hours ahead. High latitude sky watchers need to remain alert for possible auroral displays.
Thank you for reading this article! Did you have any trouble with the technical terms used in this article? Our help section is the place to be where you can find in-depth articles, a FAQ and a list with common abbreviations. Still puzzled? Just post on our forum where we will help you the best we can!
Latest news
Latest forum messages
Support SpaceWeatherLive.com!
A lot of people come to SpaceWeatherLive to follow the Solar activity or if there is a chance to see the aurora, but with more traffic comes higher costs to keep the servers online. If you like SpaceWeatherLive and want to support the project you can choose a subscription for an ad-free site or consider a donation. With your help we can keep SpaceWeatherLive online!
Space weather facts
| Last X-flare | 2025/12/08 | X1.1 |
| Last M-flare | 2025/12/31 | M7.11 |
| Last geomagnetic storm | 2026/01/02 | Kp5 (G1) |
| Spotless days | |
|---|---|
| Last spotless day | 2022/06/08 |
| Monthly mean Sunspot Number | |
|---|---|
| December 2025 | 124 +32.2 |
| January 2026 | 111.2 -12.8 |
| Last 30 days | 105.1 -4.2 |


