Three M-class solar flares, CH effects, CME watch
Tuesday, 21 April 2015 14:11 UTC
Three low-level (R1) M-class solar flares took place today, all of them located at or near the east or west limb of our star.
The first of these solar flares was an M1.0 solar flare at 07:21 UTC from departing sunspot region 2322. Sunspot region 2322 has been growing rapidly during the past 24 hours but as this sunspot region is now turning away from Earth, we have to conclude that any future eruptions from this sunspot region will not be directed towards our planet.
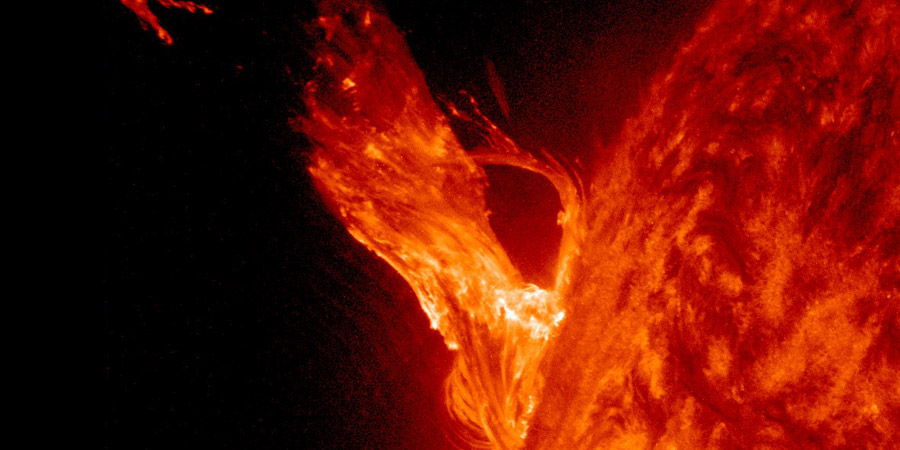
The second M-class solar flare was an M2.2 event at 10:40 UTC but it did not come from sunspot region 2322. A new sunspot region behind the east-limb was the source of this event. SDO imagery shows that is was a pretty violent event and it likely released a coronal mass ejection that is directed away from Earth.
The third and final M-class event of today (thus far... the day isn't over yet!) was also an M2.2 event. This solar flare peaked at 11:57 UTC and came from departing sunspot region 2322. It did not look eruptive but because this was also a limb event, any resulting coronal mass ejection will not be directed at Earth. Below you can watch a video by SDO showing the three M-class solar flares. The three flashes on the limbs are the M-class solar flares.
Coronal hole effects and CME watch
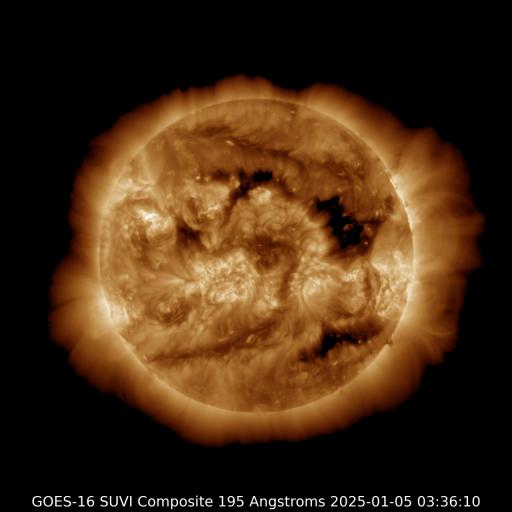
Earth is currently under the influence of a coronal hole solar wind stream. The solar wind speed is increasing to 600km/s but the strength of the IMF is at background levels (6nT) with a variable direction. Unsettled to active conditions (Kp3 to Kp4) is possible in the hours ahead.
Do note that we are also awaiting a minor coronal mass ejection associated with a C5 solar flare/filament eruption. More info about that event can be found here.
Thank you for reading this article! Did you have any trouble with the technical terms used in this article? Our help section is the place to be where you can find in-depth articles, a FAQ and a list with common abbreviations. Still puzzled? Just post on our forum where we will help you the best we can!
Current data suggests there is a moderate possibility for aurora to appear at the following high latitude regions in the near future
Fairbanks, AKCurrent data suggests there is a slight possibility for aurora to appear at the following high latitude regions in the near future
Edmonton, AB, Gillam, MB, Whitehorse, YT, Yellowknife, NTAnchorage, AK, Juneau, AK, Utqiagvik, AK
Latest news

Coronal hole faces Earth

X2.0 solar flare from sunspot region 4001

Coronal hole faces Earth, Minor G1 geomagnetic storm watch
Latest forum messages
Support SpaceWeatherLive.com!
A lot of people come to SpaceWeatherLive to follow the Sun's activity or if there is aurora to be seen, but with more traffic comes higher server costs. Consider a donation if you enjoy SpaceWeatherLive so we can keep the website online!

Latest alerts
Saturday, 15 March 2025
13:48 UTC - Hemispheric Power Index
The OVATION model predicts the Hemispheric Power Index to reach 52GW at 14:31 UTC
Friday, 14 March 2025
22:39 UTC - Solar flare
Moderate M1.16 flare

22:24 UTC - Radio Blackout
Minor R1 radio blackout in progress (≥M1 - current: M1.16)
10:55 UTC - Coronal hole
A southern hemisphere coronal hole is facing Earth. Enhanced solar wind could arrive in ~3 days
Space weather facts
| Last X-flare | 2025/02/23 | X2.0 |
| Last M-flare | 2025/03/14 | M1.1 |
| Last geomagnetic storm | 2025/03/14 | Kp6- (G2) |
| Spotless days | |
|---|---|
| Last spotless day | 2022/06/08 |
| Monthly mean Sunspot Number | |
|---|---|
| February 2025 | 154.6 +17.6 |
| March 2025 | 125.9 -28.7 |
| Last 30 days | 139.6 -15 |