Complex sunspot region 2422
Tuesday, 29 September 2015 12:46 UTC

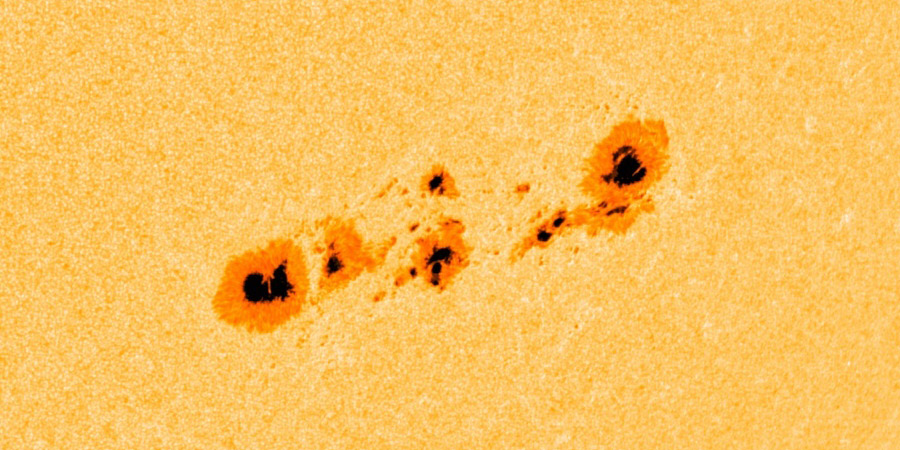
Solar activity is at high levels as our Sun continues to produce numerous M-class events. Both sunspot region 2422 and 2423 are to blame, with sunspot region 2422 being the most active and the most complex of these sunspot regions. None of these events launched an earth-directed coronal mass ejection.
As sunspot region 2422 is facing Earth right now, it is by far the most interesting sunspot region on the earth-facing disk. Let's focus our attention on this region:
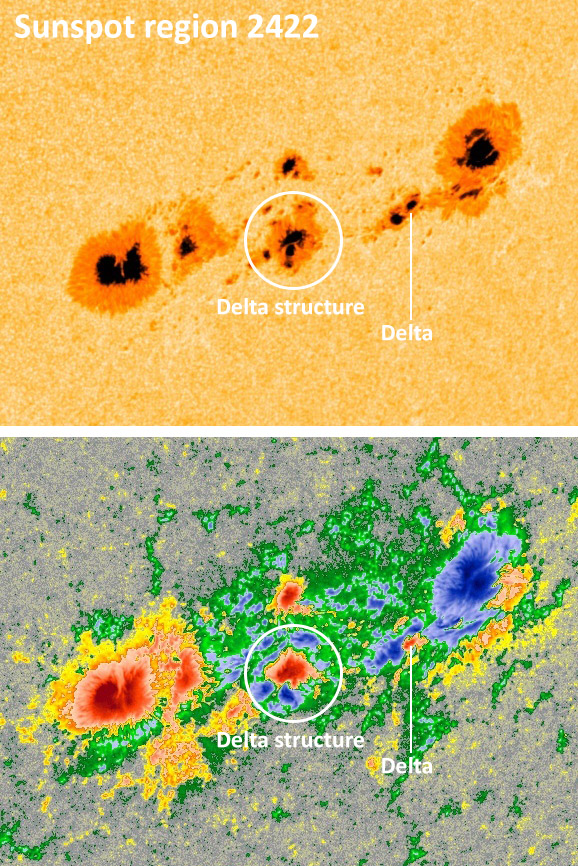
Compared to yesterday, we have to conclude that there has been some magnetic separation between the leading and trailing sunspot clusters but when we look at the delta sunspots we see that this region gained some serious magnetic complexity which will guarantee more M-class solar flares.
While there remains a small delta sunspot near the leading sunspot cluster, we see that there is one large delta sunspot surrounded by many tiny spots that have an opposite polarity. We have seen a flurry of low-level M-class activity but this structure could harbor massive magnetic tension which has the potential to let loose a strong M-class (R2) or even an X-class (R3) event.

Image: Sunspot region 2422 as seen by NASA SDO indicating two areas with magnetic delta structures.
Thank you for reading this article! Did you have any trouble with the technical terms used in this article? Our help section is the place to be where you can find in-depth articles, a FAQ and a list with common abbreviations. Still puzzled? Just post on our forum where we will help you the best we can!
Latest news
Latest forum messages
Support SpaceWeatherLive.com!
A lot of people come to SpaceWeatherLive to follow the Sun's activity or if there is aurora to be seen, but with more traffic comes higher server costs. Consider a donation if you enjoy SpaceWeatherLive so we can keep the website online!

Space weather facts
| Last X-flare | 2025/01/04 | X1.85 |
| Last M-flare | 2025/01/09 | M1.1 |
| Last geomagnetic storm | 2025/01/04 | Kp5 (G1) |
| Spotless days | |
|---|---|
| Last spotless day | 2022/06/08 |
| Monthly mean Sunspot Number | |
|---|---|
| December 2024 | 154.5 +2 |
| January 2025 | 137.6 -16.9 |
| Last 30 days | 152.2 +35.1 |


