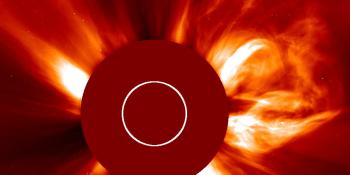
M1.5 & M7.3 solar flares from sunspot region 2173
Thursday, 2 October 2014 19:36 UTC
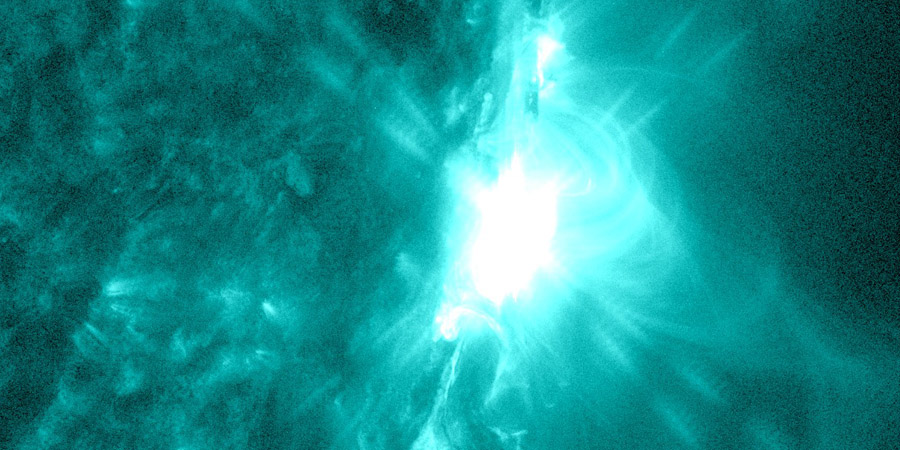
Sunspot region 2173 decayed rapidly the past few days and only a couple of sunspots remain as it approaches the west limb. This however didn't stop it from producing two M-class solar flares in rapid succesion: M1.5 (NOAA R1-minor) at 17:44 UTC and M7.3 (NOAA R2-moderate) at 19:01 UTC.
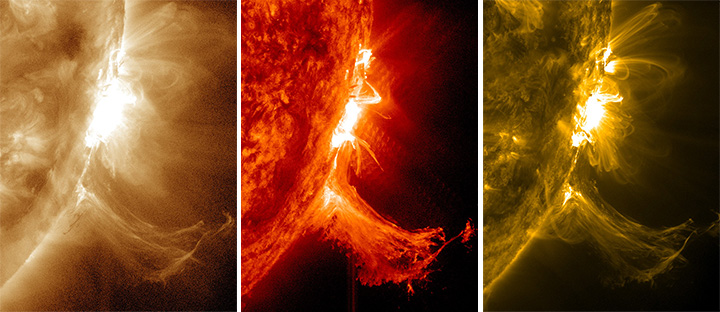
The M7.3 solar flare looks eruptive but it is too early to tell if there really is a coronal mass ejection (CME) associated with this event. Type II and IV sweeps were detected as well as eruptive signatures on SDO imagery which makes it likely that a coronal mass ejection (CME) has been launched. We do need to note that the coronal mass ejection (CME) will likely be directed away from Earth as this sunspot region is already near the west limb. We will await coronagraph imagery and post more information regarding any coronal mass ejection (CME) when we can.
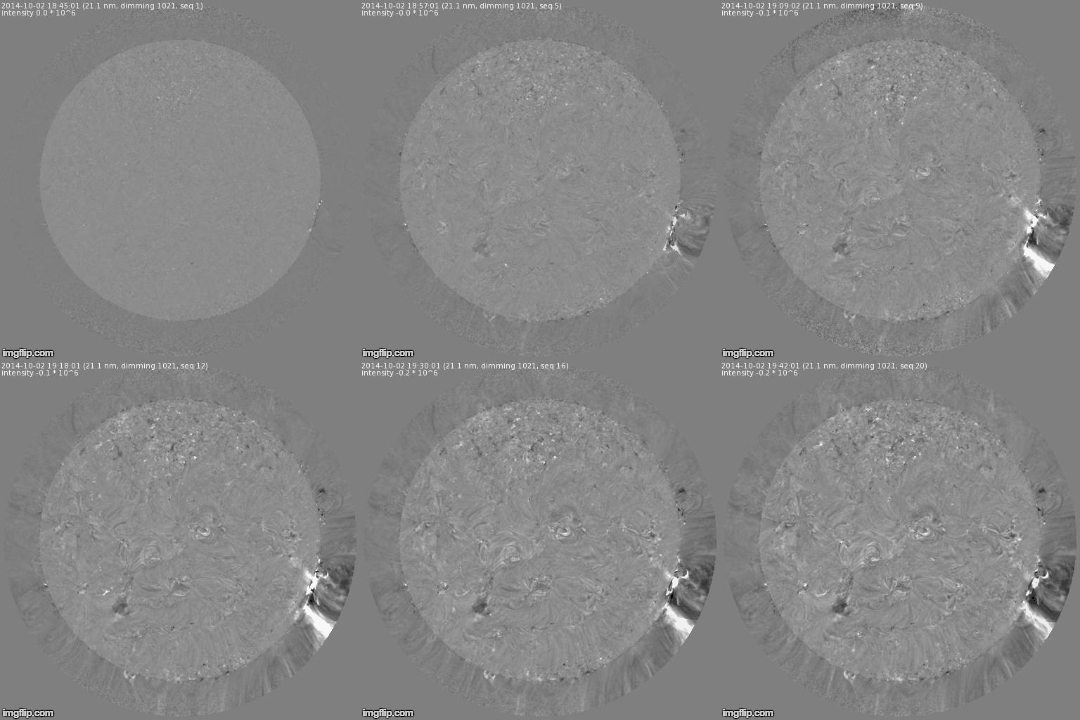
Images: NASA SDO/SIDC.
Space radiation storm
One thing to note is that this eruption could produce a space radiation storm here at Earth as this eruption is in a favourable location for high energy protons to reach Earth along the magnetic field lines of the interplanetary magnetic field. This could degrade HF radio communications at high latitudes.
NOAA SWPC alerts
ALERT: X-Ray Flux exceeded M5
Threshold Reached: 2014 Oct 02 1857 UTC
NOAA Scale: R2 - Moderate
ALERT: Type II Radio Emission
Begin Time: 2014 Oct 02 1858 UTC
Estimated Velocity: 713 km/s
ALERT: Type IV Radio Emission
Begin Time: 2014 Oct 02 1859 UTC
ALERT: Type II Radio Emission
Begin Time: 2014 Oct 02 1931 UTC
Estimated Velocity: 449 km/s
SUMMARY: X-ray Event exceeded M5
Begin Time: 2014 Oct 02 1849 UTC
Maximum Time: 2014 Oct 02 1901 UTC
End Time: 2014 Oct 02 1914 UTC
X-ray Class: M7.3
Optical Class: 1f
Location: S17W82
NOAA Scale: R2 - Moderate
Follow us on Twitter for real-time alerts. This article will be updated with more news if needed so keep coming back.
Coronal mass ejection (ADDED 06:30 UTC)
Coronagraph imagery are now available and show that the coronal mass ejection associated with the M7.3 event is as expected heading south-west and away from Earth.
Thank you for reading this article! Did you have any trouble with the technical terms used in this article? Our help section is the place to be where you can find in-depth articles, a FAQ and a list with common abbreviations. Still puzzled? Just post on our forum where we will help you the best we can!
Latest news
Latest forum messages
Support SpaceWeatherLive.com!
A lot of people come to SpaceWeatherLive to follow the Sun's activity or if there is aurora to be seen, but with more traffic comes higher server costs. Consider a donation if you enjoy SpaceWeatherLive so we can keep the website online!

Space weather facts
| Last X-flare | 2024/12/08 | X2.2 |
| Last M-flare | 2024/12/23 | M1.0 |
| Last geomagnetic storm | 2024/12/17 | Kp5+ (G1) |
| Spotless days | |
|---|---|
| Last spotless day | 2022/06/08 |
| Monthly mean Sunspot Number | |
|---|---|
| November 2024 | 152.5 -13.9 |
| December 2024 | 106.6 -45.9 |
| Last 30 days | 116.1 -41.8 |

