Double far side eruption
Wednesday, 18 October 2017 13:21 UTC
Two non earth-directed coronal mass ejections are now visible in the latest SOHO/LASCO coronagraph imagery.
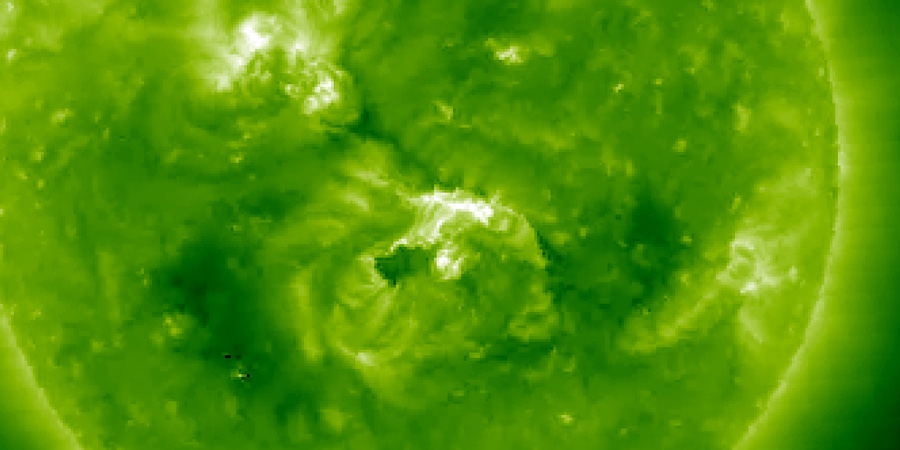
The coronal mass ejections come from a complex far side event. We are trying to conclude what exactly caused these eruptions but the imagery coming from STEREO Ahead EUVI isn't complete right now. This makes it hard to tell if these solar plasma clouds come from a filament eruption or a solar flare. A filament eruption does seem the most likely culprit at the time of writing.
Today's Type II and IV sweeps were caused by an impressive double far side eruption behind the east limb. The CMEs are not earth-directed. pic.twitter.com/WDTb8HUlDh
— SpaceWeatherLive (@_SpaceWeather_) October 18, 2017
A large-scale coronal propagating front (LCPF) which is basically a shock wave traveling trough the solar corona, rounded the east limb as seen from earth's point of view and caused the detection of a Type II radio emission and a Type IV radio emission. These were reported by the NOAA SWPC today at 06:10 UTC.
The coronal mass ejections are of course not directed towards earth.
Thank you for reading this article! Did you have any trouble with the technical terms used in this article? Our help section is the place to be where you can find in-depth articles, a FAQ and a list with common abbreviations. Still puzzled? Just post on our forum where we will help you the best we can!
Latest news

M8.1 solar flare with earth-directed CME

X1.9 solar flare, Coronal hole faces Earth

X4.0 solar flare
Latest forum messages
Support SpaceWeatherLive.com!
A lot of people come to SpaceWeatherLive to follow the Solar activity or if there is a chance to see the aurora, but with more traffic comes higher costs to keep the servers online. If you like SpaceWeatherLive and want to support the project you can choose a subscription for an ad-free site or consider a donation. With your help we can keep SpaceWeatherLive online!


Space weather facts
| Last X-flare | 2025/12/08 | X1.1 |
| Last M-flare | 2025/12/27 | M5.1 |
| Last geomagnetic storm | 2025/12/22 | Kp5 (G1) |
| Spotless days | |
|---|---|
| Last spotless day | 2022/06/08 |
| Monthly mean Sunspot Number | |
|---|---|
| November 2025 | 91.8 -22.8 |
| December 2025 | 114.9 +23.1 |
| Last 30 days | 112.3 +26.4 |