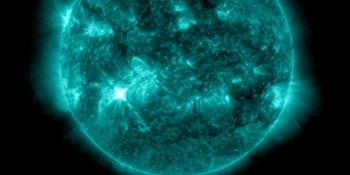
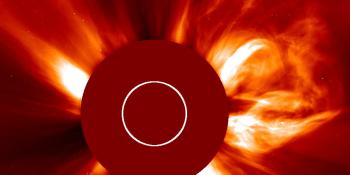
Sunspot region 2205, M7.9 solar flare
Wednesday, 5 November 2014 16:59 UTC
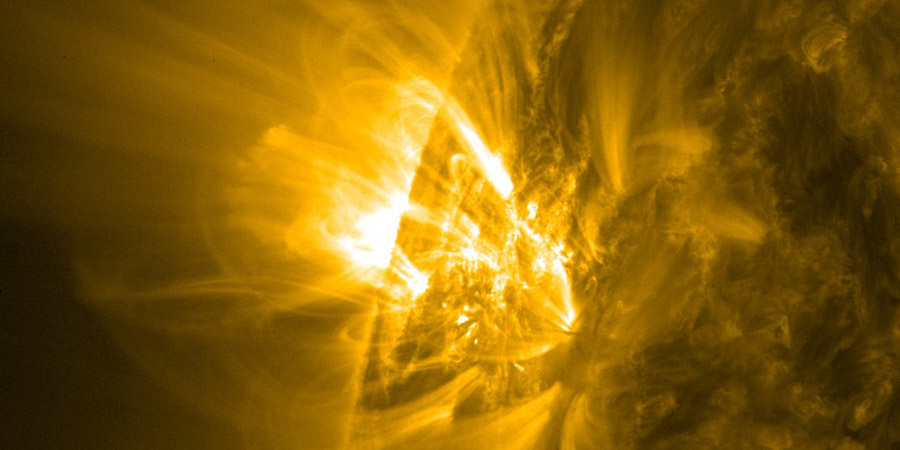
Solar activity again reached high levels as sunspot region 2205 produced an impulsive M7.9 (R2-moderate) solar flare that peaked today at 09:47 UTC. In this article we take a short look at this solar flare and we have our first analysis of sunspot region 2205 where we discuss it's magnetic layout and of course if we can expect more solar flares.
M7.9 solar flare
Sunspot region 2205 produced an impulsive M7.9 (R2-moderate) solar flare (see image below) that peaked today at 09:47 UTC. This event produced a Type II radio sweep which indicated that a coronal mass ejection might have escaped the solar corona. Updated LASCO coronagraph imagery shows that this event indeed produced a minor coronal mass ejection but it is directed east and away from Earth. Sunspot region 2205 is still too close the east limb for any eruptions to be earth-directed.
ALERT: X-Ray Flux exceeded M5
Threshold Reached: 2014 Nov 05 0944 UTC
NOAA Scale: R2 - Moderate
SUMMARY: 10cm Radio Burst
Begin Time: 2014 Nov 05 0940 UTC
Maximum Time: 2014 Nov 05 0941 UTC
End Time: 2014 Nov 05 0946 UTC
Duration: 6 minutes
Peak Flux: 229 sfu
Latest Penticton Noon Flux: 129 sfu
SUMMARY: X-ray Event exceeded M5
Begin Time: 2014 Nov 05 0926 UTC
Maximum Time: 2014 Nov 05 0947 UTC
End Time: 2014 Nov 05 0955 UTC
X-ray Class: M7.9
Location: N16E63
NOAA Scale: R2 - Moderate
ALERT: Type II Radio Emission
Begin Time: 2014 Nov 05 0943 UTC
Estimated Velocity: 816 km/s
Evolution of sunspot region 2205
Note: this analysis was made based on SDO imagery from 06:15 UTC this morning. SDO data processing is behind by 9 hours and no newer images were available at the time we published this article.
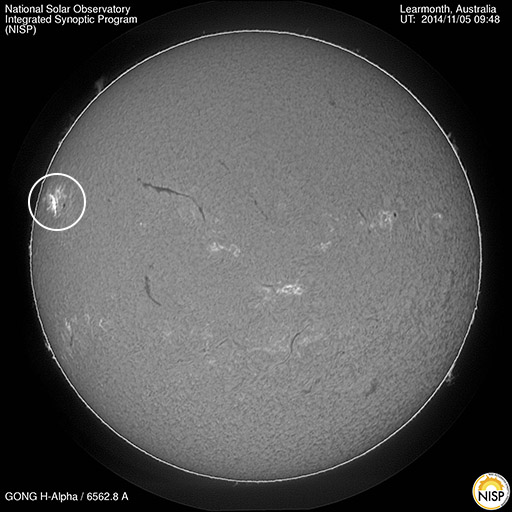
Now that sunspot region 2205 has rotated further into view, it begins to reveal it’s magnetic layout and we begin to see if there is evolution going on in this active region. When it rotated onto the visible solar disk, sunspot region 2205 was not impressive with only a few visible sunspots. The most eastern part of the cluster was beside one spot nothing but penumbral area with surrounding faculae. However, sunspot region 2205 began to reform itself gaining some new spots in this part as well as showing increased magnetic complexity. Multiple new sunspots are now visible along with some penumbral growth. We also see a decrease of the brighter faculae areas. All good signs. Although this sunspot region doesn’t look very big or terribly complex, there are two small but compact delta spots visible in this sunspot region which you can see on the image below. The ongoing development might very well produce more M-class flares with a slight chance for a low-level X-class (R3) event. For now, Earthward directed coronal mass ejections are not expected due to this sunspot region's proximity near the eastern limb but this will change in the days ahead.
M-class flare probability for the coming 24 hours: 60% chance
X-class flare probability for the coming 24 hours: 10% chance
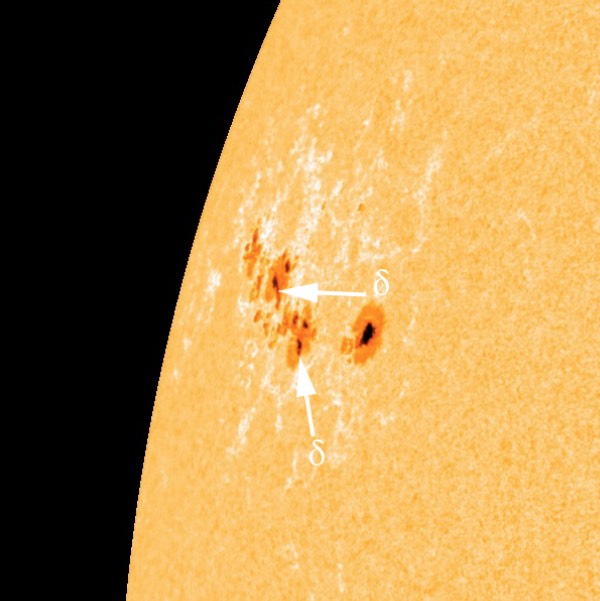
All the other sunspot regions on the disk are unremarkable and unlikely to produce strong solar flares. Any future solar flares will very likely be centered around sunspot region 2205.
Images: NASA SDO and NISP GONG H-alpha Learmonth Solar Observatory, Australia.
Thank you for reading this article! Did you have any trouble with the technical terms used in this article? Our help section is the place to be where you can find in-depth articles, a FAQ and a list with common abbreviations. Still puzzled? Just post on our forum where we will help you the best we can!
Latest news
Latest forum messages
Support SpaceWeatherLive.com!
A lot of people come to SpaceWeatherLive to follow the Sun's activity or if there is aurora to be seen, but with more traffic comes higher server costs. Consider a donation if you enjoy SpaceWeatherLive so we can keep the website online!

Space weather facts
| Last X-flare | 2024/12/08 | X2.2 |
| Last M-flare | 2024/12/25 | M4.9 |
| Last geomagnetic storm | 2024/12/17 | Kp5+ (G1) |
| Spotless days | |
|---|---|
| Last spotless day | 2022/06/08 |
| Monthly mean Sunspot Number | |
|---|---|
| November 2024 | 152.5 -13.9 |
| December 2024 | 115.2 -37.3 |
| Last 30 days | 120.1 -38.2 |
