Solar maximum is here! G2 storm watch and X-flare!
Thursday, 8 August 2024 20:16 UTC

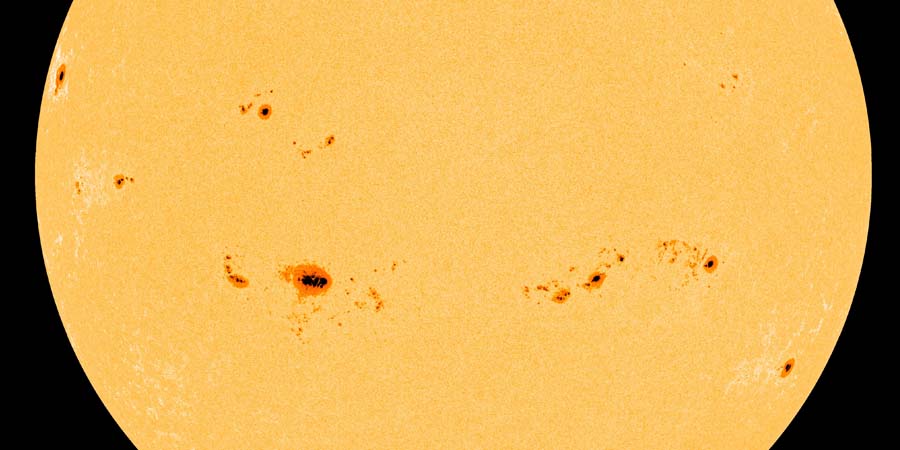
Our Sun has been very busy the past few weeks and we have now reached the highest official monthly mean sunspot number in 23 years during the month of July! We landed on a whopping 196.5 and August thus far averages an incredible monthly mean sunspot number of 222.3! Is this going to be solar maximum when we look back at Solar Cycle 25 in the coming years? It seems likely!
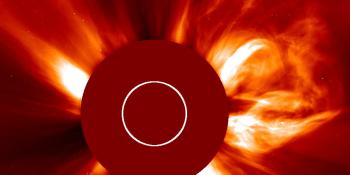
With all of these sunspots, there are also some very complex sunspot regions on the disk and they have been producing M-class and even X-class solar flares left right and center. Sunspot region 3777 actually produced a X1.3 that peaked just moments ago at 19:35 UTC! It is still too early to tell if this solar flare produced a coronal mass ejection but there have been two M-class events earlier this week which launched coronal mass ejections with an earth-directed component. The first of these coronal mass ejections is expected to arrive tomorrow thus with two coronal mass ejections incoming, storm conditions up to the moderate G2 geomagnetic storm threshold which equals a Kp of 6 are possible on Friday, 9 August as well as during the weekend on 10 and 11 August.
Thank you for reading this article! Did you have any trouble with the technical terms used in this article? Our help section is the place to be where you can find in-depth articles, a FAQ and a list with common abbreviations. Still puzzled? Just post on our forum where we will help you the best we can!
Latest news
Latest forum messages
Support SpaceWeatherLive.com!
A lot of people come to SpaceWeatherLive to follow the Sun's activity or if there is aurora to be seen, but with more traffic comes higher server costs. Consider a donation if you enjoy SpaceWeatherLive so we can keep the website online!

Space weather facts
| Last X-flare | 2024/12/08 | X2.2 |
| Last M-flare | 2024/12/22 | M1.0 |
| Last geomagnetic storm | 2024/12/17 | Kp5+ (G1) |
| Spotless days | |
|---|---|
| Last spotless day | 2022/06/08 |
| Monthly mean Sunspot Number | |
|---|---|
| November 2024 | 152.5 -13.9 |
| December 2024 | 103.3 -49.2 |
| Last 30 days | 115.4 -40.8 |


