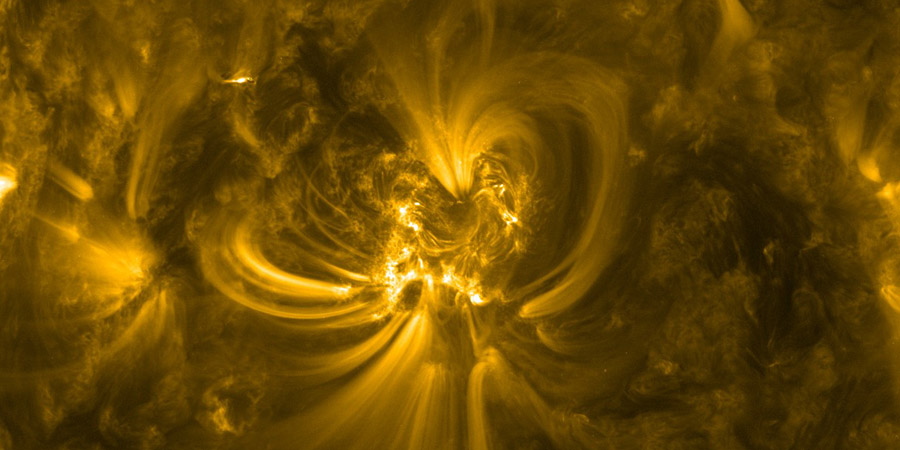
Analysis of the Solar Activity - 8 September 2014
Monday, 8 September 2014 15:33 UTC

Solar activity remains at low levels (C-class solar flares only) since the M1.1 solar flare that occured two days ago. Can we still expect strong solar flares from sunspot regions 2157 or 2158?
Analysis of the past 24h
Both sunspot regions still have magnetic delta structures but solar activity remains rather low especially when you consider the regions currently on the earth-facing solar disk.
We begin with sunspot region 2157 which was the source of a couple of low-level M-class solar flares. This region remained stable but there are spots growing just south of region 2157. These new spots look to be a new sunspot region but they might be included in 2157. Two small delta spots remain present in it's trailing section and an M-class flare remains possible.


Sunspot region 2158 is very quiet but also remains a threat for a moderate to strong solar flare. While it is not very compact it does remain relativly stable with an easily identifiable Beta-Delta magnetic layout. This might be a sleeping giant: M-class activity can not be excluded from this region.


What can we expect in the upcoming 24h?
Both regions 2157 and 2158 keep their magnetic delta layouts. An isolated M-class event from either region can not be excluded.
M-class flare probability: 30% chance
X-class flare probability: 10% chance
Thank you for reading this article! Did you have any trouble with the technical terms used in this article? Our help section is the place to be where you can find in-depth articles, a FAQ and a list with common abbreviations. Still puzzled? Just post on our forum where we will help you the best we can!
Latest news
Latest forum messages
Support SpaceWeatherLive.com!
A lot of people come to SpaceWeatherLive to follow the Solar activity or if there is a chance to see the aurora, but with more traffic comes higher costs to keep the servers online. If you like SpaceWeatherLive and want to support the project you can choose a subscription for an ad-free site or consider a donation. With your help we can keep SpaceWeatherLive online!
Latest alerts
21:51 UTC - Solar flare
Moderate M1.33 flare from sunspot region 4274
21:36 UTC - Radio Blackout
Minor R1 radio blackout in progress (≥M1 - current: M1.33)
20:30 UTC - Solar flare
Moderate M1.37 flare from sunspot region 4274
20:15 UTC - Radio Blackout
Minor R1 radio blackout in progress (≥M1 - current: M1.37)
X4.0 solar flare
A X4.0 (R3-strong) solar flare peaked at 08:30 UTC this morning. It was of course departing sunspot region 4274 which has been the source of so many solar flares and even geomagnetic storms this past week that provided the fireworks.
Read moreSpace weather facts
| Last X-flare | 2025/11/14 | X4.0 |
| Last M-flare | 2025/11/14 | M1.3 |
| Last geomagnetic storm | 2025/11/13 | Kp7+ (G3) |
| Spotless days | |
|---|---|
| Last spotless day | 2022/06/08 |
| Monthly mean Sunspot Number | |
|---|---|
| October 2025 | 114.6 -15.2 |
| November 2025 | 100.3 -14.3 |
| Last 30 days | 97.9 -36.5 |


