M6.9 coronal mass ejection, G1 geomagnetic storm watch
Friday, 19 December 2014 22:43 UTC

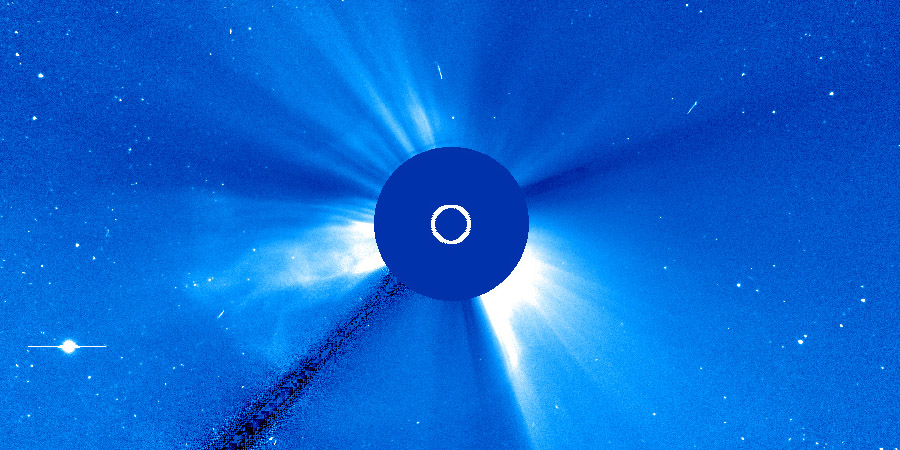
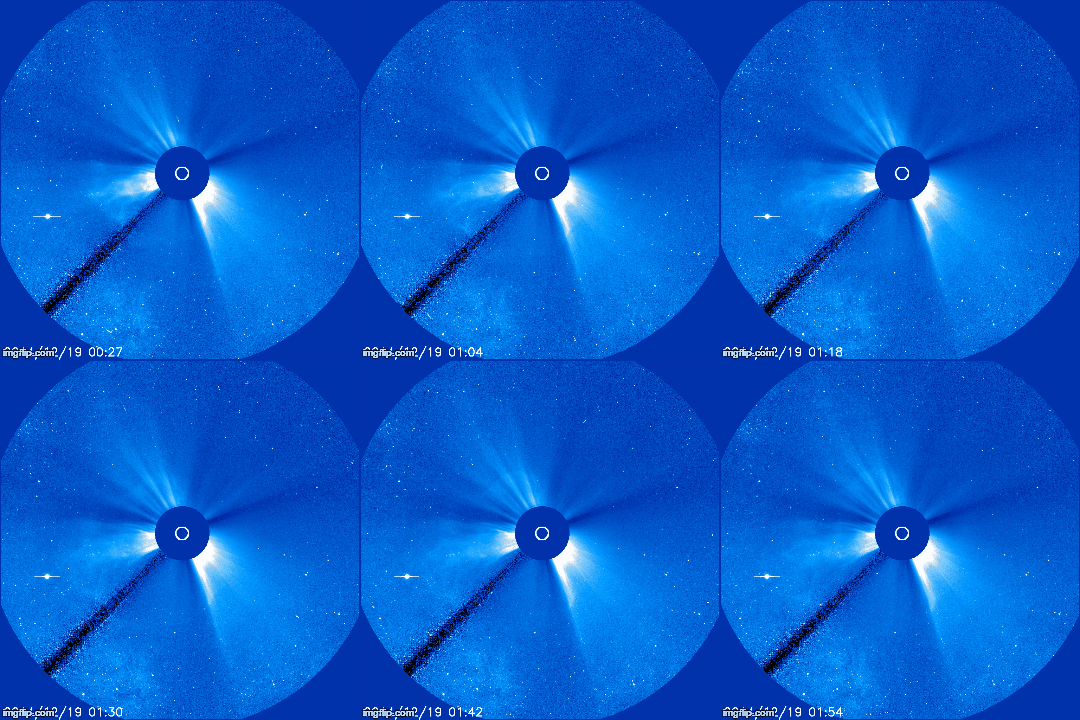
SOHO/LASCO coronagraph imagery is now available to analyse the coronal mass ejection that was launched during the M6.9 solar flare from yesterday. Good news: this coronal mass ejection indeed has an earth-directed component. A minor G1 geomagnetic storm watch is in effect for 21 and 22 December.
There are some gaps in the data from SOHO but we can see a faint asymmetrical full halo coronal mass ejection (CME) racing away from the Sun following the M6.9 solar flare. This coronal mass ejection is thus very likely directed towards earth, something which the M8 coronal mass ejection from past Wednesday was not.


The coronal mass ejection has a modest speed and is likely to arrive during the afternoon of 21 December. A minor G1 geomagnetic storm could occur on 21 December or early on 22 December if the direction of the IMF manages to turn southward. Stronger condtitions are unlikely considering the faint halo outline and modest coronal mass ejection speed. Sky watchers in southern New Zealand, Tasmania, Scandinavia, the northern parts of England and the nothern United States should be alert for possible auroral displays in the days ahead if we manage to reach G1 geomagnetic storm conditions around local midnight.
The NOAA SWPC has a watch in place for possible G1 geomagnetic storming conditions on 20 December and G2 geomagnetic storming conditions on 21 December. This is because the NOAA SWPC thinks that the M8.7 solar flare that occured on 17 December has an earth-directed component and that the arrival of these two coronal mass ejections could cause a moderate G2 geomagnetic storm. We concluded that the M8 coronal mass ejection very likely did not had an earth-directed component and consider G2 geomagnetic storm conditions unlikely.
Images: ESA/NASA SOHO.
Thank you for reading this article! Did you have any trouble with the technical terms used in this article? Our help section is the place to be where you can find in-depth articles, a FAQ and a list with common abbreviations. Still puzzled? Just post on our forum where we will help you the best we can!
Latest news
Latest forum messages
Support SpaceWeatherLive.com!
A lot of people come to SpaceWeatherLive to follow the Solar activity or if there is a chance to see the aurora, but with more traffic comes higher costs to keep the servers online. If you like SpaceWeatherLive and want to support the project you can choose a subscription for an ad-free site or consider a donation. With your help we can keep SpaceWeatherLive online!
Space weather facts
| Last X-flare | 2025/12/08 | X1.1 |
| Last M-flare | 2025/12/12 | M1.1 |
| Last geomagnetic storm | 2025/12/12 | Kp5 (G1) |
| Spotless days | |
|---|---|
| Last spotless day | 2022/06/08 |
| Monthly mean Sunspot Number | |
|---|---|
| November 2025 | 91.8 -22.8 |
| December 2025 | 125.7 +33.9 |
| Last 30 days | 109.3 +18.1 |


