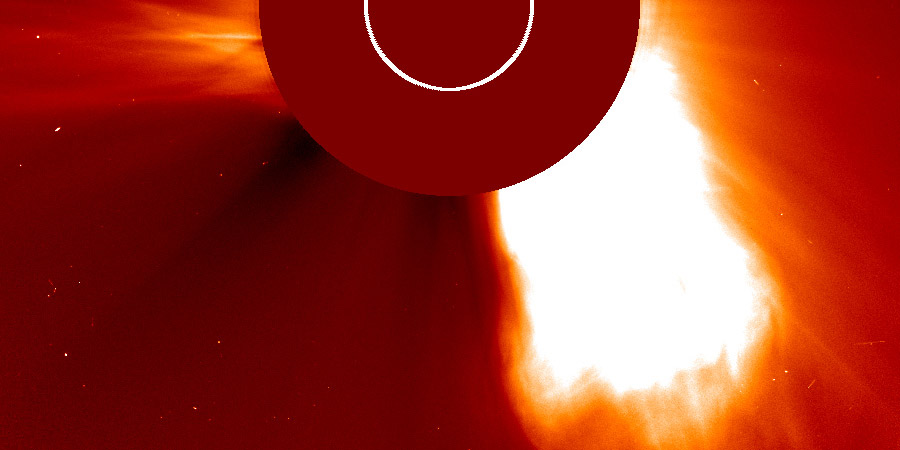
X1.8 coronal mass ejection
Saturday, 20 December 2014 15:47 UTC

SOHO/LASCO coronagraph imagery is now available to determine the size and trajectory of the coronal mass ejection that erupted from the X1.8 solar flare that occurred today. Careful analysis suggests that this coronal mass ejection has no earth-directed component.
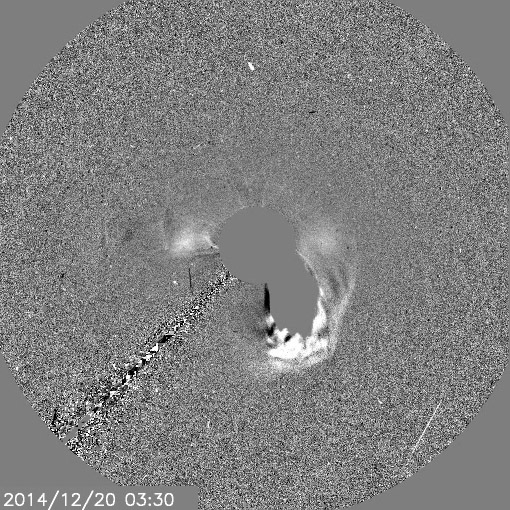
A dense but narrow coronal mass ejection can be seen leaving the Sun following the X1.8 solar flare. As we feared when looking at SDO data, this coronal mass ejection is heading to the south-west and there is absolutely no earth-directed component. A fainter component looks to be heading south and east but there is no full halo outline and it is safe to conclude that we will not see any effects at earth from this coronal mass ejection. The image below shows the X1.8 coronal mass ejection in a difference image from SOHO/LASCO C3.
Note that there is a minor G1 geomagnetic storm watch in effect for tomorrow and monday. A coronal mass ejection from an M6.9 solar flare is expected to arrive tomorrow and this could cause a minor G1 geomagnetic storm. There are no signs yet on ACE EPAM of the approaching coronal mass ejection apart from the electron flux which is slightly elevated. This could change in the hours ahead as the coronal mass ejection gets closer to ACE.
Image: NASA/ESA SOHO.
Thank you for reading this article! Did you have any trouble with the technical terms used in this article? Our help section is the place to be where you can find in-depth articles, a FAQ and a list with common abbreviations. Still puzzled? Just post on our forum where we will help you the best we can!
Latest news
Latest forum messages
Support SpaceWeatherLive.com!
A lot of people come to SpaceWeatherLive to follow the Solar activity or if there is a chance to see the aurora, but with more traffic comes higher costs to keep the servers online. If you like SpaceWeatherLive and want to support the project you can choose a subscription for an ad-free site or consider a donation. With your help we can keep SpaceWeatherLive online!
Space weather facts
| Last X-flare | 2025/12/08 | X1.1 |
| Last M-flare | 2025/12/21 | M1.3 |
| Last geomagnetic storm | 2025/12/22 | Kp5 (G1) |
| Spotless days | |
|---|---|
| Last spotless day | 2022/06/08 |
| Monthly mean Sunspot Number | |
|---|---|
| November 2025 | 91.8 -22.8 |
| December 2025 | 114.3 +22.5 |
| Last 30 days | 109.4 +22.7 |


