M-class solar flares, sunspot region 2297, incoming CME?
Tuesday, 10 March 2015 14:58 UTC
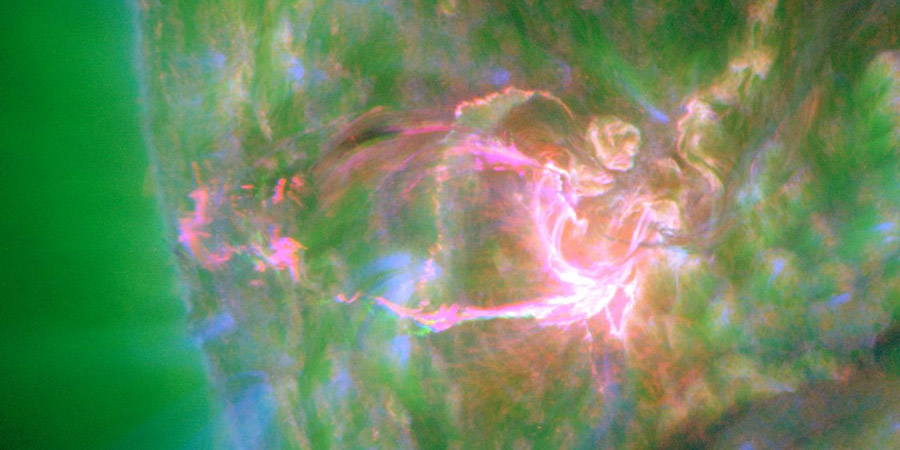
Solar activity reached high levels thanks to two M5 class solar flares since our last update. These solar flares came from the only numbered sunspot region on the Earth-facing disk: sunspot region 2297. The first of these solar flares was a long duration M5.8 solar flare that peaked yesterday at 23:53 UTC and the second one was a more impulsive M5.1 solar flare peaking today at 03:24 UTC.
Both of these solar flares produced coronal mass ejections but the first coronal mass ejection associated with the M5.8 solar flare was much more prominent, something which was to be expected as the second M5.1 solar flare was relativly impulsive.
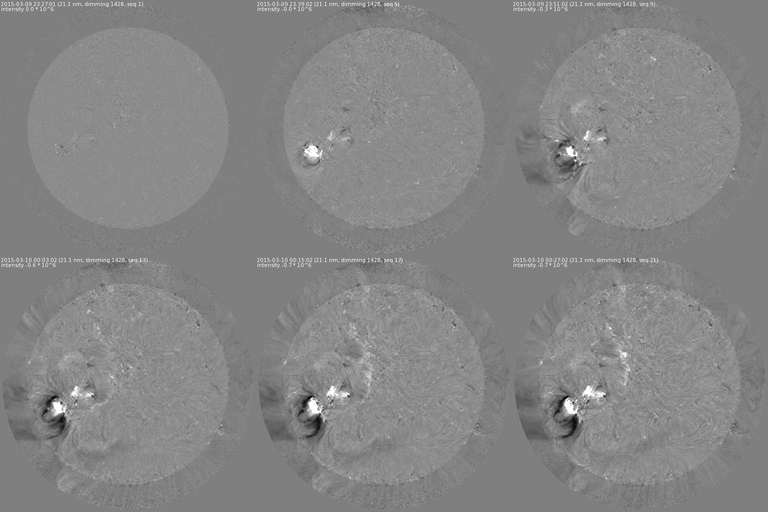
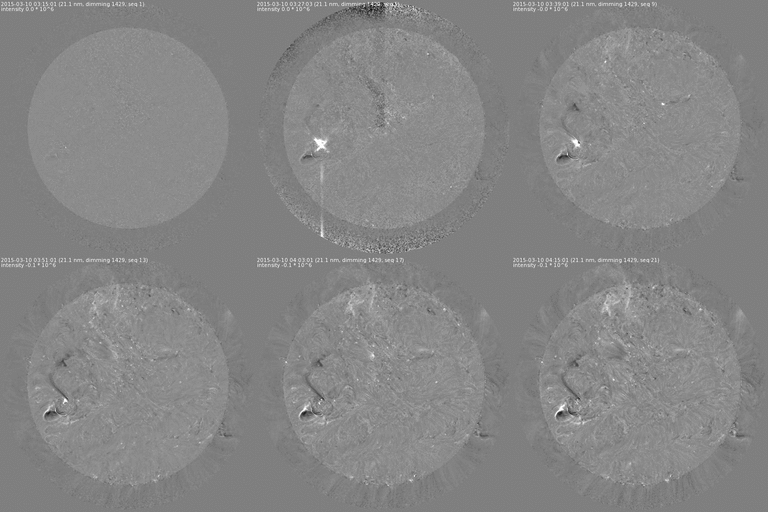
Images: The eruptive natures of both solar flares can be seen nicely in these difference images from NASA SDO. The left event (M5.8) is much more eruptive than the M5.1 event on the right.
The M5.8 solar flare produced a coronal mass ejection that is heading east and away from Earth. The halo does however extend to form almost a full halo outline which means a shock passage can not be excluded. We have to stress that the bulk of this coronal mass ejection is directed well east and away from Earth. We can actually conclude that this coronal mass ejection has a similair story as the coronal mass ejection from the M9.2 solar flare has which might still give us a glancing blow later today, but more on that later. A minor shock passage on 13 March is still possible from this event but it should have little effect on our geomagnetic field. The second (smaller) coronal mass ejection from the M5.1 solar flare looks to be heading completly to the east and away from Earth.
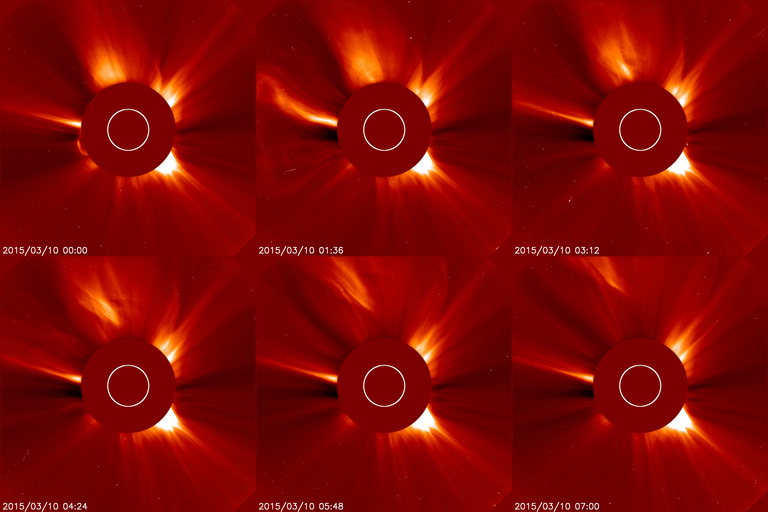
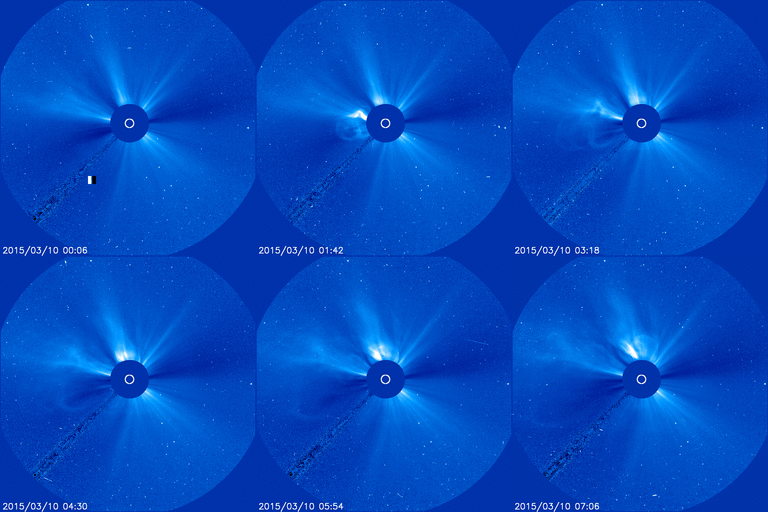
Images: The coronal mass ejections as seen by SOHO.
Sunspot region 2297
A quick look at the only sunspot region on the earth-facing disk shows that sunspot region 2297 keeps it's complex Beta-Gamma-Delta magnetic layout. And it not just keeps it's Beta-Gamma-Delta magnetic layout, it's two delta sunspots continued to grow in size and complexity. There is a tight and complex mix of opposite polarities just north and north-west of the large trailing sunspot where there is serious potential for more fireworks. We can almost say for certain that another more M-class (R1-R2) solar flare can be expected in the next 24 hours, and an X-class event (R3) is no longer out of the question. Sunspot region 2297 is now starting to face Earth so any future eruptions will have a higher chance to reach our planet in the days ahead. Exciting times!
M-class flare probability for the coming 24 hours: 70% chance
X-class flare probability for the coming 24 hours: 30% chance
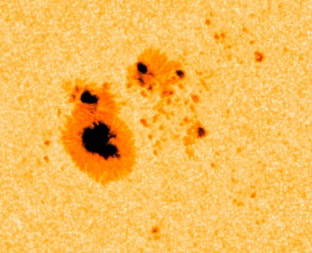
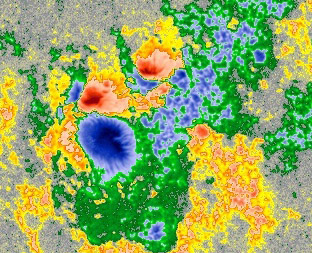
Images: Sunspot region 2297 as seen by SDO.
Incoming coronal mass ejection?
We are also on the lookout today for a possible shock passage of the M9.2 coronal mass ejection that erupted on 7th of March. While that coronal mass ejection is heading well east of our planet, there was a faint full halo outline which suggested a shock passage could not be excluded on 10 March, which is today. The low-energy protons as measured by ACE are rising indicating that a small part of the plasma cloud could indeed impact our geomagnetic field today. A minor impact is expected at most (if any) but it is still worth keeping an eye on if you are a high latitude sky watcher.
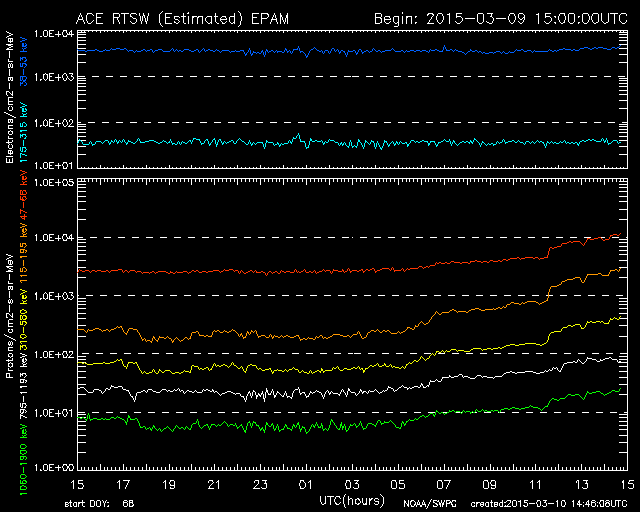
Image: Low-energy protons as measured by ACE are on the rise, a sign that we could see a minor shock passage today.
Thank you for reading this article! Did you have any trouble with the technical terms used in this article? Our help section is the place to be where you can find in-depth articles, a FAQ and a list with common abbreviations. Still puzzled? Just post on our forum where we will help you the best we can!
Latest news
Latest forum messages
Support SpaceWeatherLive.com!
A lot of people come to SpaceWeatherLive to follow the Solar activity or if there is a chance to see the aurora, but with more traffic comes higher costs to keep the servers online. If you like SpaceWeatherLive and want to support the project you can choose a subscription for an ad-free site or consider a donation. With your help we can keep SpaceWeatherLive online!
Space weather facts
| Last X-flare | 2025/12/08 | X1.1 |
| Last M-flare | 2025/12/19 | M1.0 |
| Last geomagnetic storm | 2025/12/12 | Kp5 (G1) |
| Spotless days | |
|---|---|
| Last spotless day | 2022/06/08 |
| Monthly mean Sunspot Number | |
|---|---|
| November 2025 | 91.8 -22.8 |
| December 2025 | 125.7 +33.9 |
| Last 30 days | 111.4 +22.1 |


