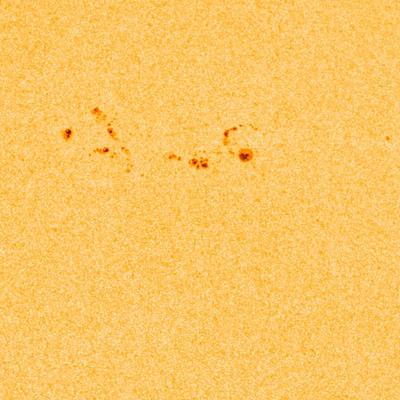
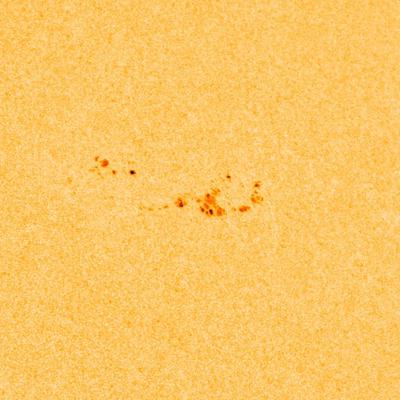
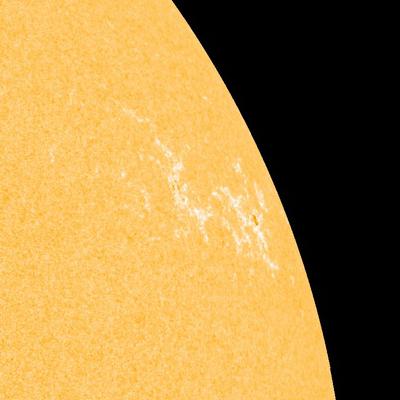
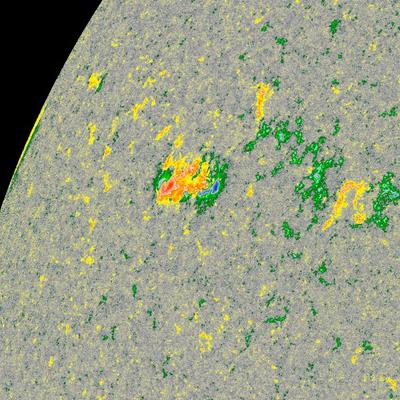
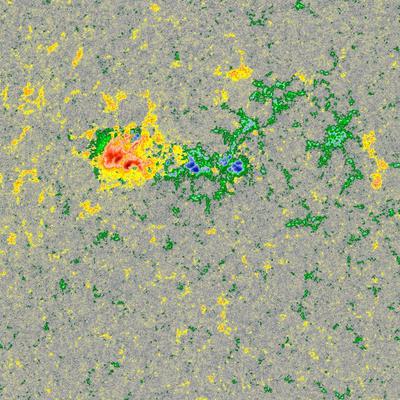
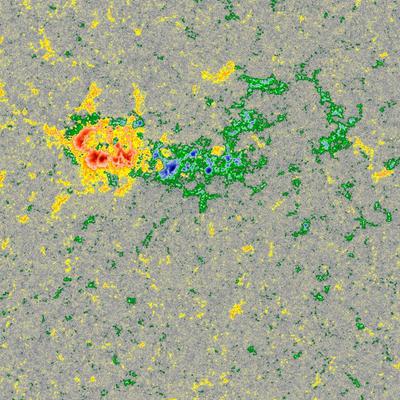
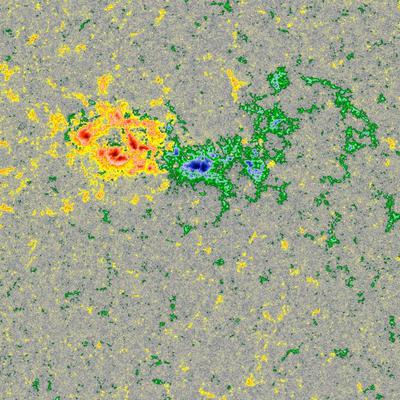
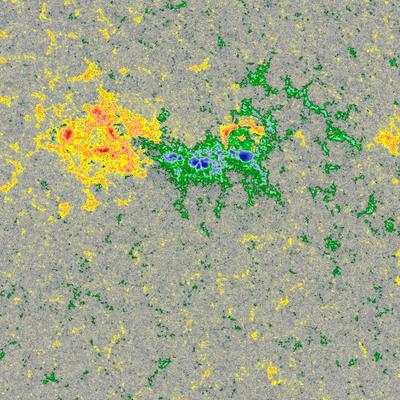
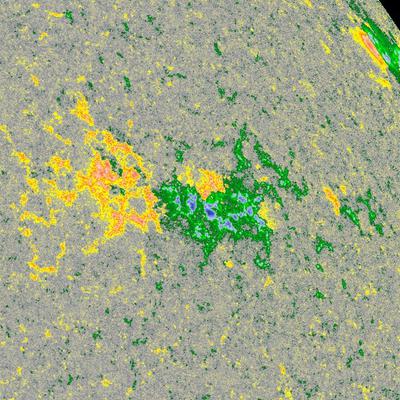
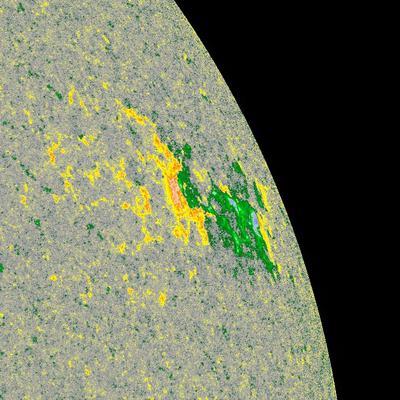
Sunspot region AR12918
| Number of sunspots |
Size | Class Magn. | Class Spot | Location | |
|---|---|---|---|---|---|
| 2021/12/22 | 4 | 20 | CRO | N20E52 | |
| 2021/12/23 | 6 | 80 | DAO | N20E38 | |
| 2021/12/24 | 15 | 140 | DAI | N19E23 | |
| 2021/12/25 | 17 | 280 | DKI | N19E11 | |
| 2021/12/26 | 17 | 260 | DKI | N19W03 | |
| 2021/12/27 | 15 | 180 | DAI | N19W17 | |
| 2021/12/28 | 15 | 180 | EAI | N22W31 | |
| 2021/12/29 | 10 | 210 | CRI | N19W43 | |
| 2021/12/30 | 9 | 60 | BXI | N22W55 | |
| 2021/12/31 | 2 | 20 | BXO | S16W49 | |
| 2022/01/01 | 2 | 20 | BXO | N22W81 |
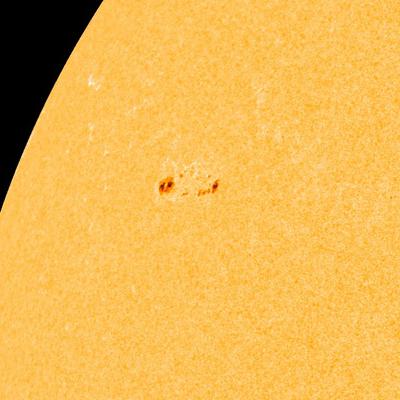
2021/12/22
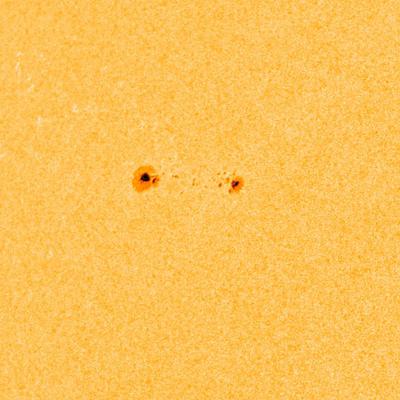
2021/12/23

2021/12/24

2021/12/25

2021/12/26
2021/12/27
2021/12/28

2021/12/29

2021/12/30
2021/12/31

2022/01/01
|
2021/12/22

2021/12/23
2021/12/24
2021/12/25
2021/12/26
2021/12/27

2021/12/28
2021/12/29

2021/12/30
2021/12/31

2022/01/01
|
| B | C | M |
|---|---|---|
| 17 | 21 | 3 |
The top 10 solar flares from sunspot region 12918
| Start | Maximum | End | ||||
|---|---|---|---|---|---|---|
| 1 | M1.89 | 2021/12/28 | 03:50 | 04:01 | 04:10 | |
| 2 | M1.6 | 2021/12/28 | 15:59 | 16:11 | 16:20 | |
| 3 | M1.1 | 2022/01/01 | 07:07 | 07:30 | 07:42 | |
| 4 | C9.8 | 2021/12/31 | 06:46 | 06:56 | 07:06 | |
| 5 | C8.2 | 2021/12/31 | 19:32 | 19:46 | 20:02 | |
| 6 | C7.1 | 2021/12/28 | 07:29 | 07:44 | 07:57 | |
| 7 | C4.6 | 2021/12/31 | 06:26 | 06:41 | 06:46 | |
| 8 | C3.4 | 2021/12/25 | 18:53 | 19:05 | 19:15 | |
| 9 | C3.3 | 2021/12/25 | 13:19 | 13:30 | 13:35 | |
| 10 | C3.2 | 2021/12/25 | 16:14 | 16:19 | 16:24 |
Latest news

Sunday, 7 December 2025
M8.1 solar flare with earth-directed CME

Monday, 1 December 2025
X1.9 solar flare, Coronal hole faces Earth

Friday, 14 November 2025
X4.0 solar flare
Latest forum messages
AR14317 & 14318 24AR14321 8Current Farside Activity 263Filaments and prominences 416Aurora viewing locations in WA 35
More topicsSupport SpaceWeatherLive.com!
A lot of people come to SpaceWeatherLive to follow the Solar activity or if there is a chance to see the aurora, but with more traffic comes higher costs to keep the servers online. If you like SpaceWeatherLive and want to support the project you can choose a subscription for an ad-free site or consider a donation. With your help we can keep SpaceWeatherLive online!


Space weather facts
| Last X-flare | 2025/12/08 | X1.1 |
| Last M-flare | 2025/12/21 | M1.3 |
| Last geomagnetic storm | 2025/12/22 | Kp5 (G1) |
| Spotless days | |
|---|---|
| Last spotless day | 2022/06/08 |
| Monthly mean Sunspot Number | |
|---|---|
| November 2025 | 91.8 -22.8 |
| December 2025 | 114.3 +22.5 |
| Last 30 days | 110.4 +23.9 |