Viewing archive of Monday, 26 July 2004
Geophysical report
Any mentioned solar flare in this report has a scaling factor applied by the Space Weather Prediction Center (SWPC). Because of the SWPC scaling factor, solar flares are reported as 42% smaller than for the science quality data. The scaling factor has been removed from our archived solar flare data to reflect the true physical units.
:Product: 20040726SGAS.txt
:Issued: 2004 Jul 26 0250 UT
Prepared by the NOAA © SWPC and processed by SpaceWeatherLive.comJoint USAF/NOAA Solar and Geophysical Activity Summary
SGAS Number 208 Issued at 0245Z on 26 Jul 2004 This report is compiled from data received at SWO on 25 JulA. Energetic Events
Begin  Max  End  Rgn   Loc   Xray  Op 245MHz 10cm   Sweep
 0025 0032 0036  0652 N09W26 C7.4  Sf        200
 0539 0551 0558  0652 N10W31 M7.1  2b 81     810       IV
 0630 0639 0645  0652 N03W27 M1.0  1f        34
 1231 1233 1234                       130
 1318 1325 1332  0652        C2.1     150
 1337 1349 1355  0652        M2.2     620    65
 1419 1514 1643  0652 N08W33 M1.1  1f 2100   120       IV
 1521 0000 1526                                     II
 1638 1639 1646                              170
 1956 1957 1957                       220    63
B. Proton Events
A greater than 10 MeV proton event accompanied
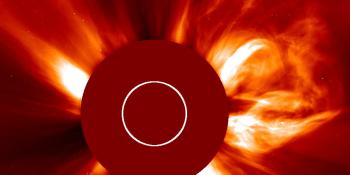
the long duration M1 flare and CME that occurred at 25/1514Z. The
proton event began at 25/1855Z and remains in progress. The peak so
far was 55 pfu at 25/2305Z.
C. Geomagnetic Activity Summary
The geomagnetic field was at
active to severe storm levels. The shock observed at the ACE
spacecraft on 24/0600Z was followed by a prolonged period of
southward IMF Bz that lasted through midway on 25 July. Bz ranged
from -10 to -20 nT for much of this period, while solar wind speed
was elevated in the 550 to 700 km/s range. Consequently, severe
geomagnetic storm levels were observed at all latitudes. It is
likely that this activity was associated with the complex series of
CMEs observed on 22 July. Late in this period, a discontinuity in
the solar wind suggested that transient flow from the multiple CME
activity on 23 July had arrived.
D. Stratwarm
None
E. Daily Indices: (real-time preliminary/estimated values)
10 cm 145  SSN 130  Afr/Ap 091/122   X-ray Background B7.2
Daily Proton Fluence (flux accumulation over 24 hrs)
GT 1 MeV 1.9e+07   GT 10 MeV 5.9e+05 p/(cm2-ster-day)
(GOES-11 satellite synchronous orbit W97 degrees)
Daily Electron Fluence
GT 2 MeV 9.30e+07 e/(cm2-ster-day)
(GOES-12 satellite synchronous orbit W75 degrees)
3 Hour K-indices
Boulder 5 6 6 7 6 7 6 6 Planetary 6 7 7 8 6 7 6 7
F. Comments
None
All times in UTC
Latest news
Latest forum messages
AR 13932 34Space Weather Memes 613Strong far side CME 341Unexplained proton activity 10Unspecified geomagnetic activity 1752
More topicsSupport SpaceWeatherLive.com!
A lot of people come to SpaceWeatherLive to follow the Sun's activity or if there is aurora to be seen, but with more traffic comes higher server costs. Consider a donation if you enjoy SpaceWeatherLive so we can keep the website online!

Space weather facts
| Last X-flare | 2024/12/08 | X2.2 |
| Last M-flare | 2024/12/23 | M8.9 |
| Last geomagnetic storm | 2024/12/17 | Kp5+ (G1) |
| Spotless days | |
|---|---|
| Last spotless day | 2022/06/08 |
| Monthly mean Sunspot Number | |
|---|---|
| November 2024 | 152.5 -13.9 |
| December 2024 | 106.6 -45.9 |
| Last 30 days | 116.1 -41.8 |


