Viewing archive of Sunday, 11 October 2009
Solar activity report
Prepared by the NOAA © SWPC and processed by SpaceWeatherLive.com
Joint USAF/NOAA Report of Solar and Geophysical Activity
SDF Number 284 Issued at 2200Z on 11 Oct 2009IA. Analysis of Solar Active Regions and Activity from 10-2100Z to 11-2100Z
IB. Solar Activity Forecast
IIA. Geophysical Activity Summary 10-2100Z to 11-2100Z
IIB. Geophysical Activity Forecast
III. Event Probabilities 12 Oct to 14 Oct
| Class M | 01% | 01% | 01% |
| Class X | 01% | 01% | 01% |
| Proton | 01% | 01% | 01% |
| PCAF | green | ||
IV. Penticton 10.7 cm Flux
  Observed       11 Oct 070
  Predicted   12 Oct-14 Oct  070/070/070
  90 Day Mean        11 Oct 069
V. Geomagnetic A Indices
  Observed Afr/Ap 10 Oct  000/002
  Estimated     Afr/Ap 11 Oct  007/007
  Predicted    Afr/Ap 12 Oct-14 Oct  007/007-005/005-005/005
VI. Geomagnetic Activity Probabilities 12 Oct to 14 Oct
| A. Middle Latitudes | |||
|---|---|---|---|
| Active | 10% | 05% | 05% |
| Minor storm | 01% | 01% | 01% |
| Major-severe storm | 01% | 01% | 01% |
| B. High Latitudes | |||
|---|---|---|---|
| Active | 15% | 10% | 10% |
| Minor storm | 01% | 01% | 01% |
| Major-severe storm | 01% | 01% | 01% |
All times in UTC
Current data suggests there is a moderate possibility for aurora to appear at the following high latitude regions in the near future
Gillam, MB, Whitehorse, YTFairbanks, AK
Current data suggests there is a slight possibility for aurora to appear at the following high latitude regions in the near future
Edmonton, AB, Saskatoon, SK, Yellowknife, NTAnchorage, AK, Juneau, AK
Current data suggests there is a slight possibility for aurora to appear at the following middle latitude regions in the near future
Calgary, ABLatest news
X1.1 solar flare

Coronal hole faces Earth
Strong G3 geomagnetic storm watch for 23 March
Latest forum messages
Support SpaceWeatherLive.com!
A lot of people come to SpaceWeatherLive to follow the Sun's activity or if there is aurora to be seen, but with more traffic comes higher server costs. Consider a donation if you enjoy SpaceWeatherLive so we can keep the website online!

Latest alerts
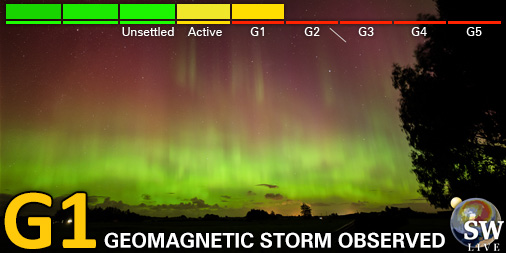
04:15 UTC - Geomagnetic activity
Minor G1 geomagnetic storm (Kp5) Threshold Reached: 04:05 UTC
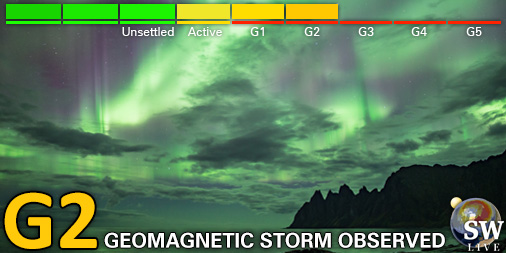
03:15 UTC - Geomagnetic activity
Moderate G2 geomagnetic storm (Kp6) Threshold Reached: 02:59 UTC
01:00 UTC - Geomagnetic activity
Minor G1 geomagnetic storm (Kp5) Threshold Reached: 00:51 UTC

Friday, 4 April 2025
23:30 UTC - Geomagnetic activity
Minor G1 geomagnetic storm (Kp5) Threshold Reached: 23:17 UTC

21:03 UTC - Hemispheric Power Index
The OVATION model predicts the Hemispheric Power Index to reach 75GW at 21:49 UTC
Space weather facts
| Last X-flare | 2025/03/28 | X1.1 |
| Last M-flare | 2025/04/01 | M2.5 |
| Last geomagnetic storm | 2025/04/04 | Kp5+ (G1) |
| Spotless days | |
|---|---|
| Last spotless day | 2022/06/08 |
| Monthly mean Sunspot Number | |
|---|---|
| March 2025 | 134.2 -20.4 |
| April 2025 | 148 +13.8 |
| Last 30 days | 130.9 -15.2 |