Viewing archive of Tuesday, 8 May 2012
Solar activity report
Any mentioned solar flare in this report has a scaling factor applied by the Space Weather Prediction Center (SWPC). Because of the SWPC scaling factor, solar flares are reported as 42% smaller than for the science quality data. The scaling factor has been removed from our archived solar flare data to reflect the true physical units.
Report of Solar-Geophysical Activity 2012 May 08 2200 UTCPrepared by the NOAA © SWPC and processed by SpaceWeatherLive.com
Joint USAF/NOAA Report of Solar and Geophysical Activity
SDF Number 129 Issued at 2200Z on 08 May 2012IA. Analysis of Solar Active Regions and Activity from 07-2100Z to 08-2100Z
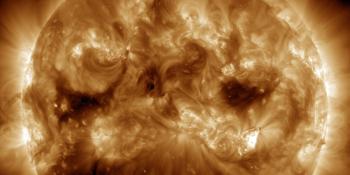
Solar activity has been at moderate levels for the past
24 hours. Region 1476 (N11E35) is the most complex region on the
visible disk, has grown to become a Fkc/beta-gamma-delta
configuration, and has an area of approximately 940 Millionths. It
also produced the largest flare, a M1/1f at 08/1308Z, as well as
several C-class flares. COR2 imagery from the STEREO-A spacecraft
indicated two weak Earth-directed CMEs that are not expected to have
significant impacts upon arrival.
IB. Solar Activity Forecast
Solar activity is expected to be at
low to moderate levels for the next three days (09 - 11 May).
IIA. Geophysical Activity Summary 07-2100Z to 08-2100Z
The geomagnetic field has been at quiet levels for the past 24 hours.
IIB. Geophysical Activity Forecast
The geomagnetic field is
expected to be quiet to unsettled on day one (09 May). Day two (10
May) is expected to be at quiet to active levels with a chance for
minor storm periods due to the effects of the Coronal Hole High
Speed Stream (CH HSS) and the anticipated arrival of the CME that
departed the solar disk on 07 May. Day three (11 May) is expected
to return to quiet to unsettled levels as the effects of the CH HSS
begin to wane.
III. Event Probabilities 09 May to 11 May
| Class M | 65% | 65% | 65% |
| Class X | 10% | 10% | 10% |
| Proton | 01% | 01% | 01% |
| PCAF | green | ||
IV. Penticton 10.7 cm Flux
  Observed       08 May 123
  Predicted   09 May-11 May  120/115/115
  90 Day Mean        08 May 112
V. Geomagnetic A Indices
  Observed Afr/Ap 07 May  004/003
  Estimated     Afr/Ap 08 May  006/007
  Predicted    Afr/Ap 09 May-11 May  009/012-015/018-013/015
VI. Geomagnetic Activity Probabilities 09 May to 11 May
| A. Middle Latitudes | |||
|---|---|---|---|
| Active | 30% | 35% | 25% |
| Minor storm | 10% | 15% | 10% |
| Major-severe storm | 01% | 05% | 01% |
| B. High Latitudes | |||
|---|---|---|---|
| Active | 15% | 10% | 15% |
| Minor storm | 30% | 30% | 25% |
| Major-severe storm | 40% | 50% | 35% |
All times in UTC
Latest news
Saturday, 22 March 2025
Strong G3 geomagnetic storm watch for 23 March

Wednesday, 5 March 2025
Coronal hole faces Earth

Sunday, 23 February 2025
X2.0 solar flare from sunspot region 4001
Latest forum messages
AR4036 3AR14028 2025/03/21 CME 2025/03/23 G3 Watch 70Filaments and prominences 744CMEs from March 16-17 and small CH 258Space Weather Memes 687
More topicsSupport SpaceWeatherLive.com!
A lot of people come to SpaceWeatherLive to follow the Sun's activity or if there is aurora to be seen, but with more traffic comes higher server costs. Consider a donation if you enjoy SpaceWeatherLive so we can keep the website online!

Space weather facts
| Last X-flare | 2025/02/23 | X2.0 |
| Last M-flare | 2025/03/21 | M1.2 |
| Last geomagnetic storm | 2025/03/21 | Kp5+ (G1) |
| Spotless days | |
|---|---|
| Last spotless day | 2022/06/08 |
| Monthly mean Sunspot Number | |
|---|---|
| February 2025 | 154.6 +17.6 |
| March 2025 | 140.3 -14.3 |
| Last 30 days | 141.7 -9.5 |