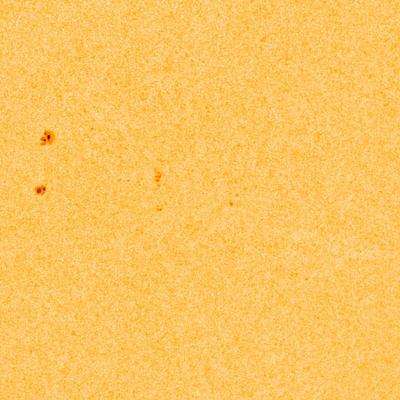
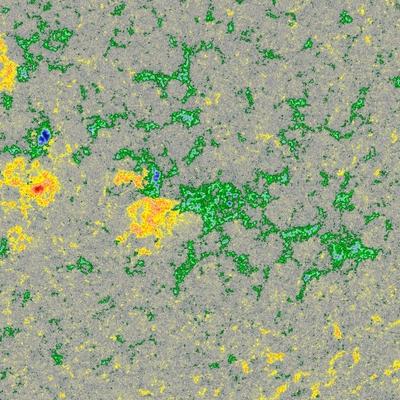
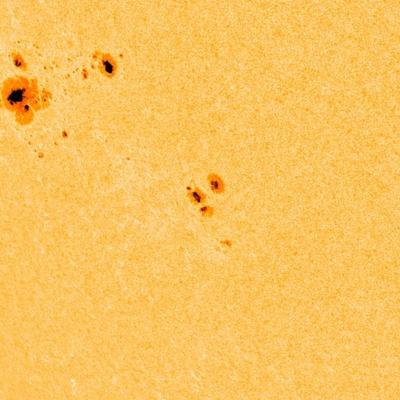
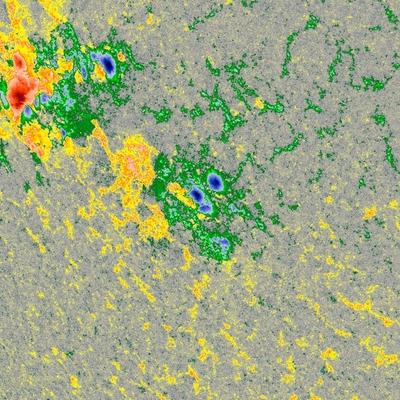
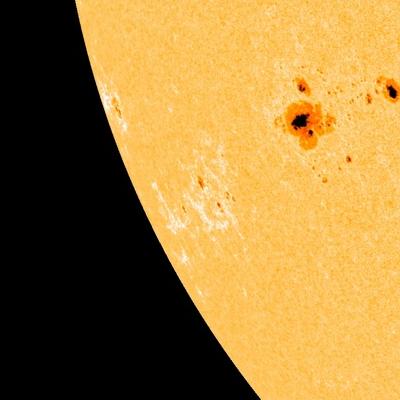
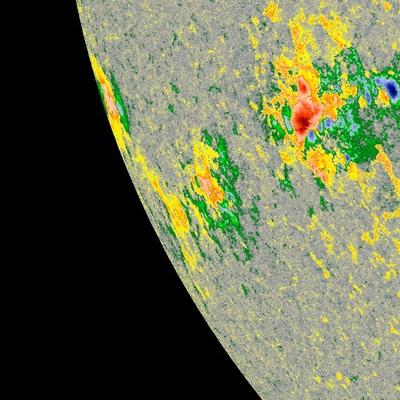
Viewing archive of Saturday, 6 September 2014 - Sunspot regions
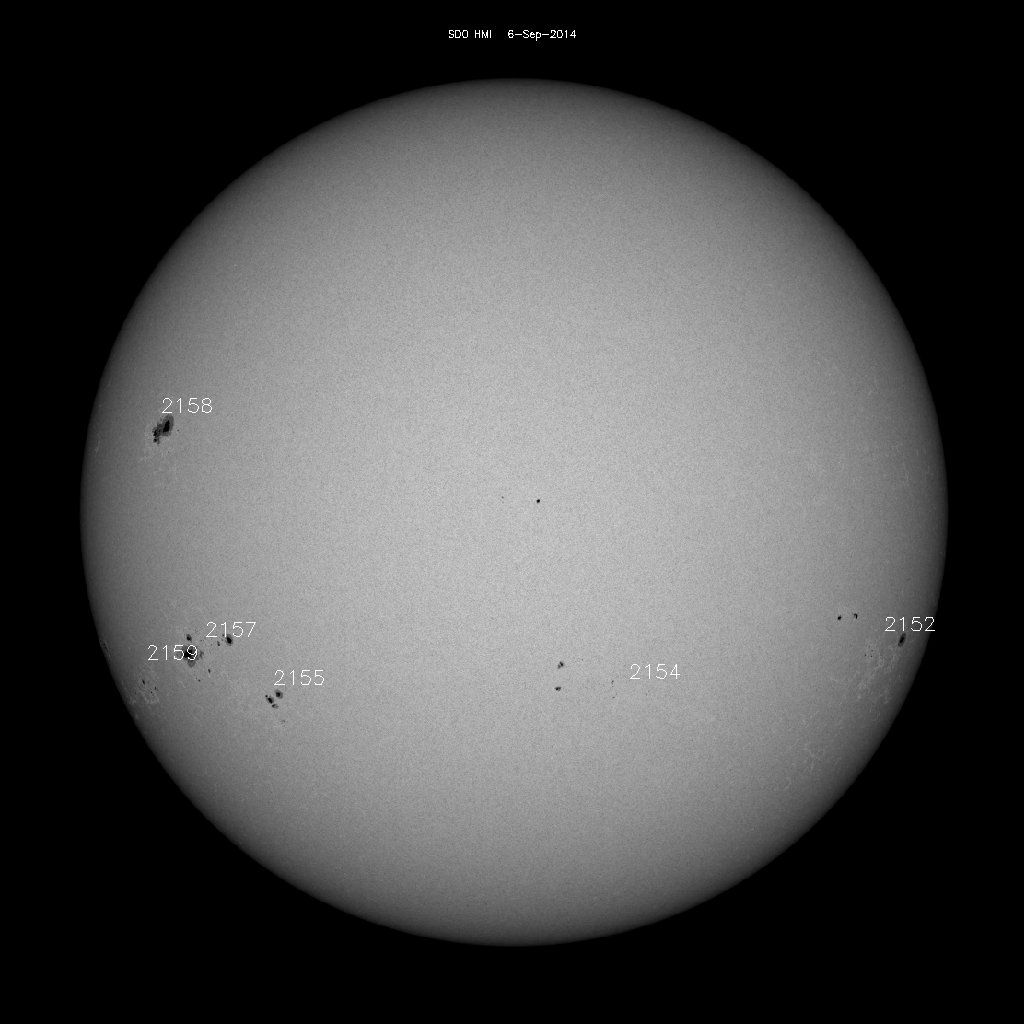
Courtesy of SDO, SOHO (NASA) and the [AIA, EVE, and/or HMI] consortium.
| Sunspot number | New regions | Background flux | Maximum flux | C | M |
|---|---|---|---|---|---|
| 170 46 | 3 2 | C1.57 | M1.61 | 5 | 2 |
Sunspot regions
Region 12151 |
||||
|---|---|---|---|---|
| Number of sunspots |
Size | Class Magn. | Class Spot | Location |
| 2 | 60 | HAX | S08W0* | |
Region 12152 |
||||
|---|---|---|---|---|
| Number of sunspots |
Size | Class Magn. | Class Spot | Location |
| 11 -5 | 190 -120 | EAO | S15W51 | |

|
||||
Solar flares on this day | ||||
| C2.48 | ||||
Region 12153 |
||||
|---|---|---|---|---|
| Number of sunspots |
Size | Class Magn. | Class Spot | Location |
| 4 -5 | 150 -40 | DSO | S09W78 | |
|
||||
Region 12154 |
||||
|---|---|---|---|---|
| Number of sunspots |
Size | Class Magn. | Class Spot | Location |
| 9 -1 | 40 20 | CAO | S18W05 | |
|
||||
Region 12155 |
||||
|---|---|---|---|---|
| Number of sunspots |
Size | Class Magn. | Class Spot | Location |
| 6 3 | 120 -50 | DAO | S20E47 | |
|
||||
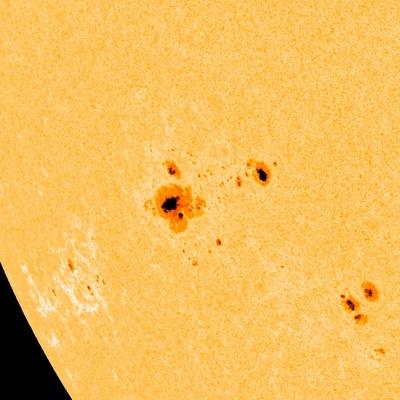
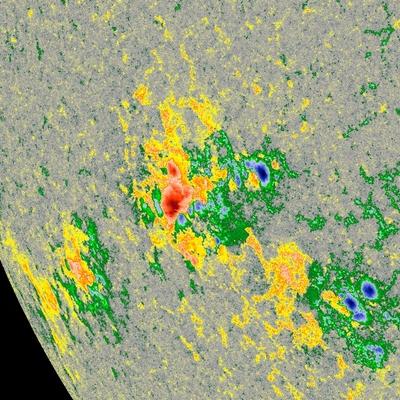
Region 12157 |
||||
|---|---|---|---|---|
| Number of sunspots |
Size | Class Magn. | Class Spot | Location |
| 14 2 | 520 320 | DKC | S14E58 | |
|
||||
Solar flares on this day | ||||
| C4.24 C3.41 M1.15 C3.59 M1.61 C6.78 | ||||
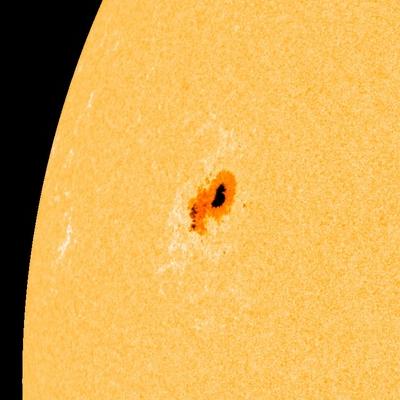
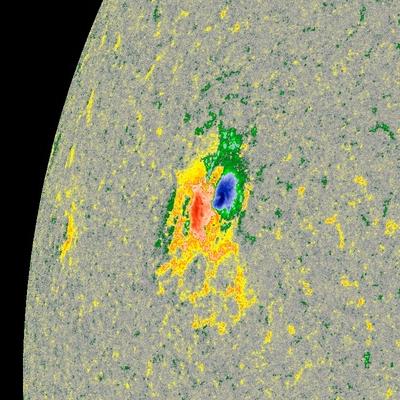
Region 12158 |
||||
|---|---|---|---|---|
| Number of sunspots |
Size | Class Magn. | Class Spot | Location |
| 4 2 | 300 200 | CKO | N15E68 | |
|
||||
Region 12159 |
||||
|---|---|---|---|---|
| Number of sunspots |
Size | Class Magn. | Class Spot | Location |
| 6 | 30 | CAO | S19E74 | |
|
||||
All times in UTC
Current data suggests there is a slight possibility for aurora to appear at the following high latitude regions in the near future
Iqaluit, NUNuuk
Sodankylä
Reykjavik
Tromsø
Kiruna
Latest news

Wednesday, 5 March 2025
Coronal hole faces Earth

Sunday, 23 February 2025
X2.0 solar flare from sunspot region 4001

Friday, 7 February 2025
Coronal hole faces Earth, Minor G1 geomagnetic storm watch
Latest forum messages
Coronal Hole 22 89Filaments and prominences 720Ask your obscure/"stupid" space weather questions. 343IP cameras for sky surveillance 53Incoming & Unnumbered Active Regions 1629
More topicsSupport SpaceWeatherLive.com!
A lot of people come to SpaceWeatherLive to follow the Sun's activity or if there is aurora to be seen, but with more traffic comes higher server costs. Consider a donation if you enjoy SpaceWeatherLive so we can keep the website online!

Latest alerts
Saturday, 15 March 2025
13:48 UTC - Hemispheric Power Index
The OVATION model predicts the Hemispheric Power Index to reach 52GW at 14:31 UTC
Space weather facts
| Last X-flare | 2025/02/23 | X2.0 |
| Last M-flare | 2025/03/14 | M1.1 |
| Last geomagnetic storm | 2025/03/14 | Kp6- (G2) |
| Spotless days | |
|---|---|
| Last spotless day | 2022/06/08 |
| Monthly mean Sunspot Number | |
|---|---|
| February 2025 | 154.6 +17.6 |
| March 2025 | 125.9 -28.7 |
| Last 30 days | 136.5 -20.3 |