Viewing archive of Sunday, 7 May 2023
Geophysical report
Solar and Geophysical Activity Summary 2023 May 07 0245 UTCPrepared by the NOAA © SWPC and processed by SpaceWeatherLive.com
Joint USAF/NOAA Solar and Geophysical Activity Summary
SGAS Number 127 Issued at 0245Z on 07 May 2023 This report is compiled from data received at SWO on 06 MayA. Energetic Events
Begin  Max  End  Rgn   Loc   Xray  Op 245MHz 10cm   Sweep
 0011 0031 0036  3297 N10E40 C2.3  Sf 100           II
 0052      0323                                        IV
 0252 0253 0255                       170
 0340 0340 0340                       100
 0358 0358 0358                       110
 0645 0645 0645                       100
 1146 1146 1146                       150
 1149 1149 1149                       120
 1237 1237 1239                       1900
 1518 1518 1520                       1900
 1622 1622 1622                       110
 1738 1745 1752  3297 N09E25 C1.8  Sf 160
 1921 1922 1922                       250
 2256 2257 2259                       270
B. Proton Events
C. Geomagnetic Activity Summary
D. Stratwarm
E. Daily Indices: (real-time preliminary/estimated values)
10 cm 152  SSN 099  Afr/Ap 021/028   X-ray Background B8.8
Daily Proton Fluence (flux accumulation over 24 hrs)
GT 1 MeV 4.9e+05   GT 10 MeV 2.3e+04 p/(cm2-ster-day)
(GOES-16 satellite synchronous orbit W75 degrees)
Daily Electron Fluence
GT 2 MeV 7.70e+06 e/(cm2-ster-day)
(GOES-16 satellite synchronous orbit W75 degrees)
3 Hour K-indices
Boulder 4 5 5 3 3 3 3 2 Planetary 4 6 4 4 4 3 3 2
F. Comments
None.
All times in UTC
Current data suggests there is a moderate possibility for aurora to appear at the following high latitude regions in the near future
Gillam, MB, Yellowknife, NTCurrent data suggests there is a slight possibility for aurora to appear at the following high latitude regions in the near future
Edmonton, AB, Iqaluit, NU, Saskatoon, SK, Whitehorse, YTNuuk
Juneau, AK
Reykjavik
Current data suggests there is a slight possibility for aurora to appear at the following middle latitude regions in the near future
Thunder Bay, ON, Winnipeg, MBLatest news

Coronal hole faces Earth

X2.0 solar flare from sunspot region 4001

Coronal hole faces Earth, Minor G1 geomagnetic storm watch
Latest forum messages
Support SpaceWeatherLive.com!
A lot of people come to SpaceWeatherLive to follow the Sun's activity or if there is aurora to be seen, but with more traffic comes higher server costs. Consider a donation if you enjoy SpaceWeatherLive so we can keep the website online!

Latest alerts
03:45 UTC - Geomagnetic activity
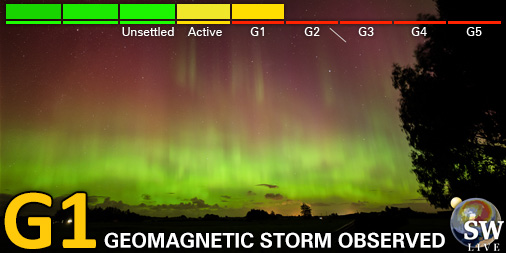
Minor G1 geomagnetic storm (Kp5) Threshold Reached: 03:35 UTC

03:15 UTC - Geomagnetic activity
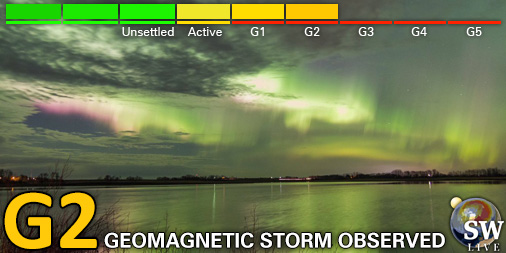
Moderate G2 geomagnetic storm (Kp6) Threshold Reached: 02:59 UTC
01:45 UTC - Geomagnetic activity
Minor G1 geomagnetic storm (Kp5) Threshold Reached: 01:36 UTC

00:18 UTC - Hemispheric Power Index
The OVATION model predicts the Hemispheric Power Index to reach 101GW at 01:06 UTC
Friday, 21 March 2025
23:45 UTC - Geomagnetic activity
Minor G1 geomagnetic storm (Kp5) Threshold Reached: 23:30 UTC
Space weather facts
| Last X-flare | 2025/02/23 | X2.0 |
| Last M-flare | 2025/03/21 | M1.2 |
| Last geomagnetic storm | 2025/03/21 | Kp5+ (G1) |
| Spotless days | |
|---|---|
| Last spotless day | 2022/06/08 |
| Monthly mean Sunspot Number | |
|---|---|
| February 2025 | 154.6 +17.6 |
| March 2025 | 140.3 -14.3 |
| Last 30 days | 141.7 -9.5 |