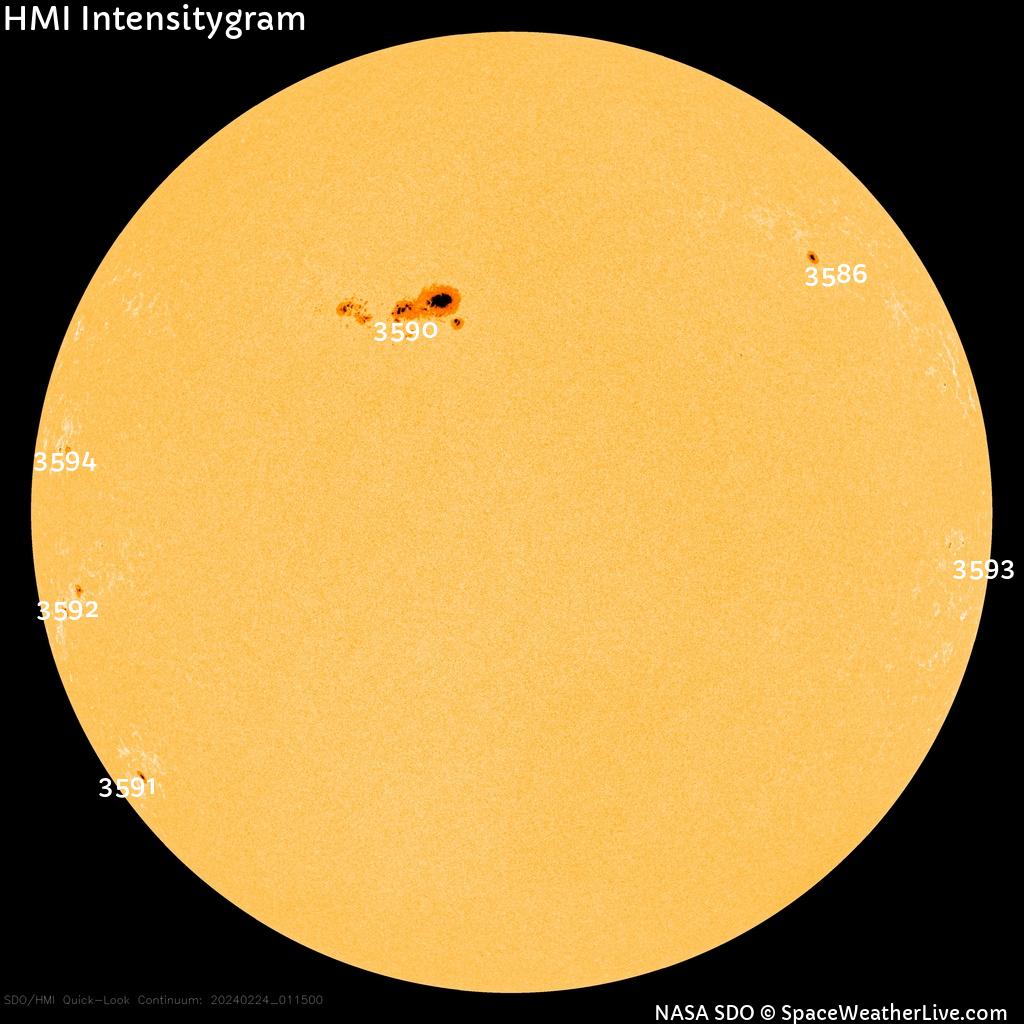
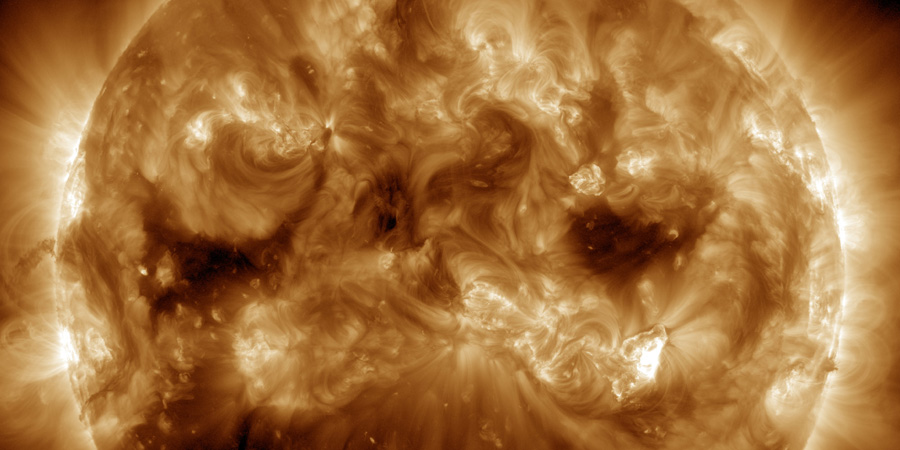
Viewing archive of Saturday, 24 February 2024 - Sunspot regions
| Sunspot number | New regions | Background flux | Maximum flux | C | M |
|---|---|---|---|---|---|
| 106 -10 | 0 -4 | C1.67 | M4.53 | 11 | 4 |
Sunspot regions
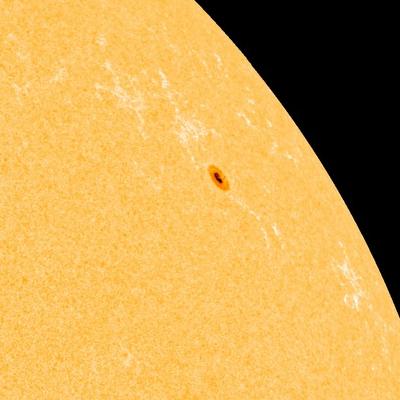
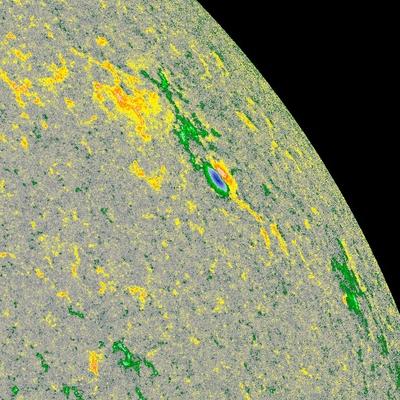
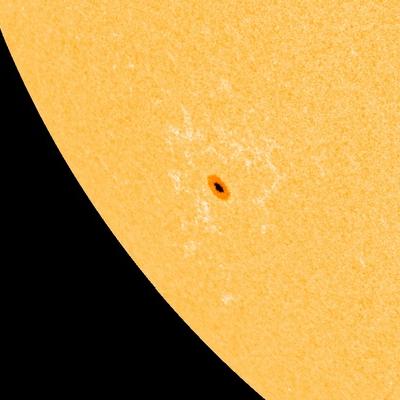
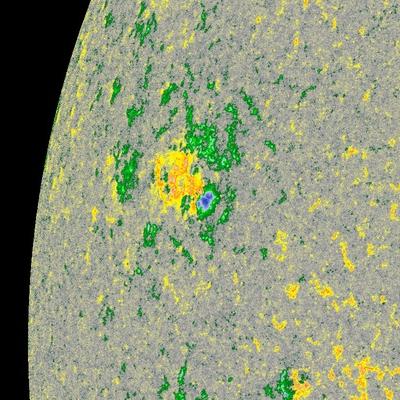
Region 13586 |
||||
|---|---|---|---|---|
| Number of sunspots |
Size | Class Magn. | Class Spot | Location |
| 1 | 80 | HSX | N27W58 | |
|
||||
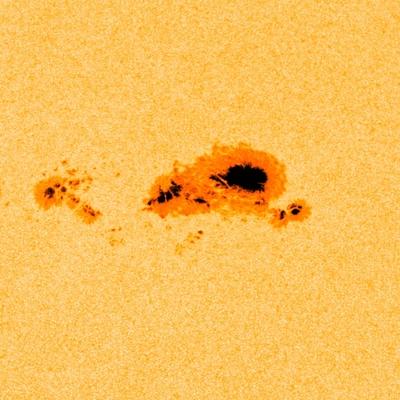
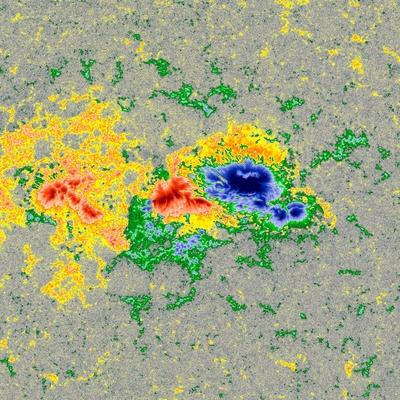
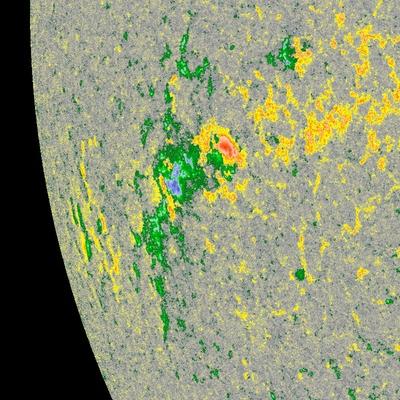
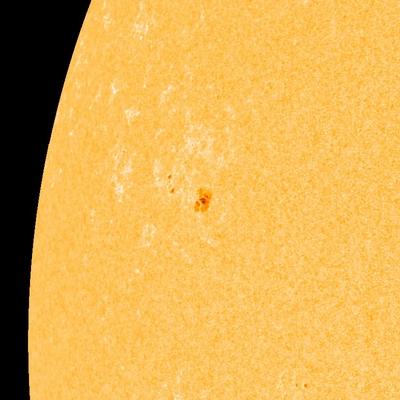
Region 13590 |
||||
|---|---|---|---|---|
| Number of sunspots |
Size | Class Magn. | Class Spot | Location |
| 45 1 | 1400 250 | FKC | N18W01 | |
|
||||
Solar flares on this day | ||||
| C3.5 C5.9 C3.3 M4.5 C4.4 C5.2 C2.7 M2.2 M3.6 C9.9 C3.9 C4.0 C5.7 C7.8 C4.3 | ||||
Region 13591 |
||||
|---|---|---|---|---|
| Number of sunspots |
Size | Class Magn. | Class Spot | Location |
| 1 | 40 -20 | HSX | S36E60 | |
|
||||
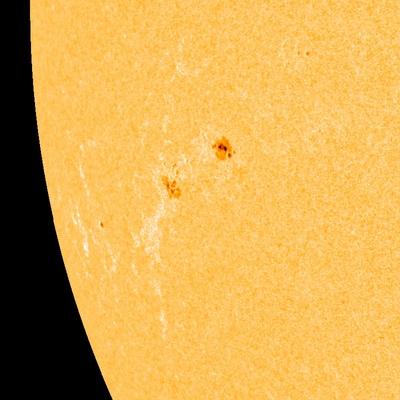
Region 13592 |
||||
|---|---|---|---|---|
| Number of sunspots |
Size | Class Magn. | Class Spot | Location |
| 5 3 | 140 60 | DSO | S14E57 | |
|
||||
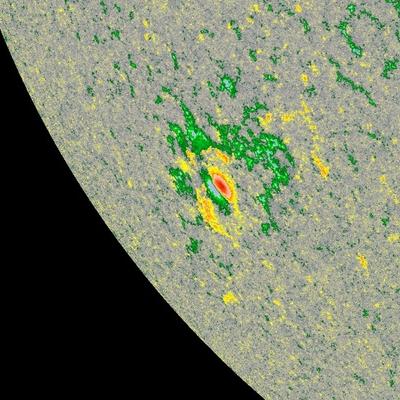
Region 13594 |
||||
|---|---|---|---|---|
| Number of sunspots |
Size | Class Magn. | Class Spot | Location |
| 4 -1 | 50 20 | CAO | N06E56 | |
|
||||
All times in UTC
Current data suggests there is a slight possibility for aurora to appear at the following high latitude regions in the near future
Oulu, Rovaniemi, SodankyläArkhangelsk, Murmansk, Norilsk, Vorkuta
Latest news
Strong G3 geomagnetic storm watch for 23 March

Coronal hole faces Earth

X2.0 solar flare from sunspot region 4001
Latest forum messages
Support SpaceWeatherLive.com!
A lot of people come to SpaceWeatherLive to follow the Sun's activity or if there is aurora to be seen, but with more traffic comes higher server costs. Consider a donation if you enjoy SpaceWeatherLive so we can keep the website online!

Latest alerts
Strong G3 geomagnetic storm watch for 23 March
Yesterday around 16 UTC an M1.2 solar flare took place around sunspot region 4028. The solar flare triggered a filament eruption which erupted from the center of the earth-facing solar disk.
12:18 UTC - Hemispheric Power Index
The OVATION model predicts the Hemispheric Power Index to reach 75GW at 13:10 UTC
03:45 UTC - Geomagnetic activity
Minor G1 geomagnetic storm (Kp5) Threshold Reached: 03:35 UTC

03:15 UTC - Geomagnetic activity
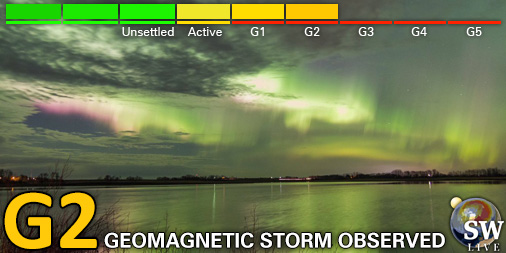
Moderate G2 geomagnetic storm (Kp6) Threshold Reached: 02:59 UTC
01:45 UTC - Geomagnetic activity
Minor G1 geomagnetic storm (Kp5) Threshold Reached: 01:36 UTC

Space weather facts
| Last X-flare | 2025/02/23 | X2.0 |
| Last M-flare | 2025/03/21 | M1.2 |
| Last geomagnetic storm | 2025/03/21 | Kp5+ (G1) |
| Spotless days | |
|---|---|
| Last spotless day | 2022/06/08 |
| Monthly mean Sunspot Number | |
|---|---|
| February 2025 | 154.6 +17.6 |
| March 2025 | 140.3 -14.3 |
| Last 30 days | 141.7 -9.5 |