Coronal hole, Sunspot region 2470
Saturday, 12 December 2015 19:19 UTC

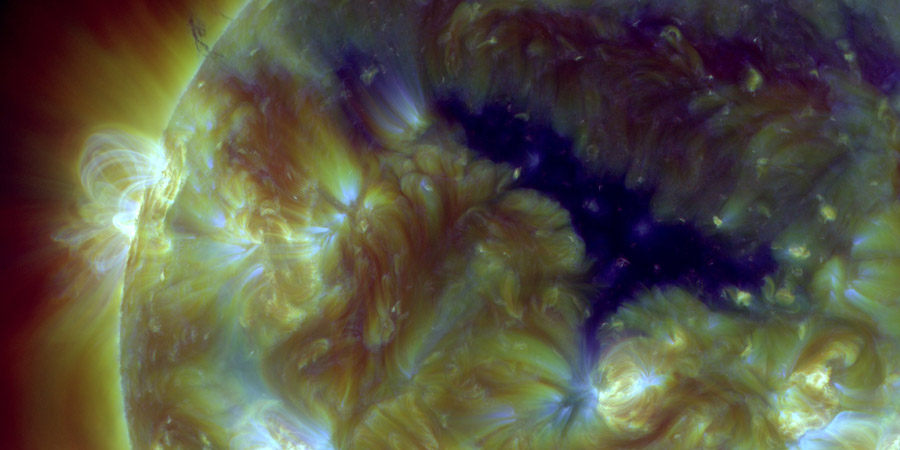
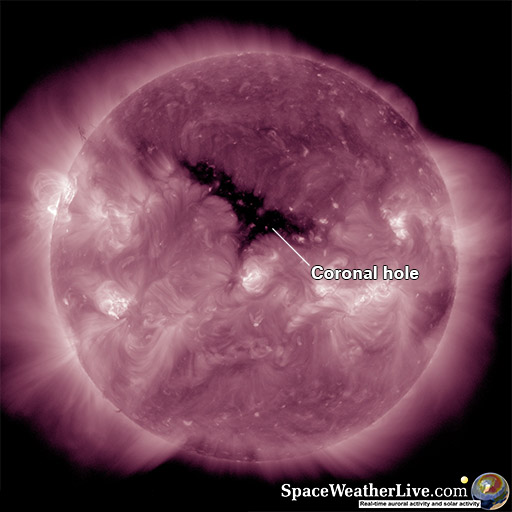
Coronal hole solar wind stream effects are now finally waning a bit but fear not, another coronal hole is facing Earth right now.
This coronal hole is not very big and it is not trans equatorial but we should again see an enhanced solar wind stream at Earth in about 3 days from now, on 15 December. Active (Kp4) geomagnetic conditions are possible once the stream arrives.

Sunspot region 2470
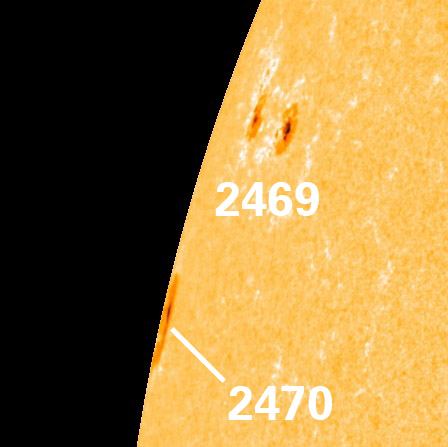
A new sunspot region on the north-east limb which has recieved sunspot number 2470 is currently producing C-class solar flares. The strongest of these flares was a C7.8 solar flare that peaked at 13:46 UTC.
| region | Start | Maximum | End | |
|---|---|---|---|---|
| 2470 | C7.8 | 13:36 | 13:46 | 13:57 |
We can not yet see much of this sunspot region apart from one large sunspot. More sunspots are likely still hiding behind the limb. In the coming days we will find out if it has what it takes to produce M-class solar flares.

All the other sunspot regions on the Earth-facing solar disk are magnetically simple and are unlikely candidates to produce M-class solar flares. SOHO/LASCO coronagraph imagery has been limited the past few days due to a so-called keyhole period for the SOHO spacecraft but no earth-directed coronal mass ejections were spotted in available imagery.
Thank you for reading this article! Did you have any trouble with the technical terms used in this article? Our help section is the place to be where you can find in-depth articles, a FAQ and a list with common abbreviations. Still puzzled? Just post on our forum where we will help you the best we can!
Latest news
Latest forum messages
Support SpaceWeatherLive.com!
A lot of people come to SpaceWeatherLive to follow the Sun's activity or if there is aurora to be seen, but with more traffic comes higher server costs. Consider a donation if you enjoy SpaceWeatherLive so we can keep the website online!

Latest alerts
01:45 UTC - Geomagnetic activity
Minor G1 geomagnetic storm (Kp5) Threshold Reached: 01:30 UTC
Tuesday, 15 April 2025
22:30 UTC - Geomagnetic activity
Moderate G2 geomagnetic storm (Kp6) Threshold Reached: 22:23 UTC
22:15 UTC - Geomagnetic activity
Minor G1 geomagnetic storm (Kp5) Threshold Reached: 22:00 UTC
20:00 UTC - Geomagnetic activity
Moderate G2 geomagnetic storm (Kp6) Threshold Reached: 19:44 UTC
19:15 UTC - Geomagnetic activity
Minor G1 geomagnetic storm (Kp5) Threshold Reached: 18:59 UTC
Space weather facts
| Last X-flare | 2025/03/28 | X1.1 |
| Last M-flare | 2025/04/15 | M1.2 |
| Last geomagnetic storm | 2025/04/15 | Kp6+ (G2) |
| Spotless days | |
|---|---|
| Last spotless day | 2022/06/08 |
| Monthly mean Sunspot Number | |
|---|---|
| March 2025 | 134.2 -20.4 |
| April 2025 | 124.1 -10.1 |
| Last 30 days | 124.7 -16.6 |


