Incoming CME? Dst-index
Monday, 10 October 2016 19:27 UTC

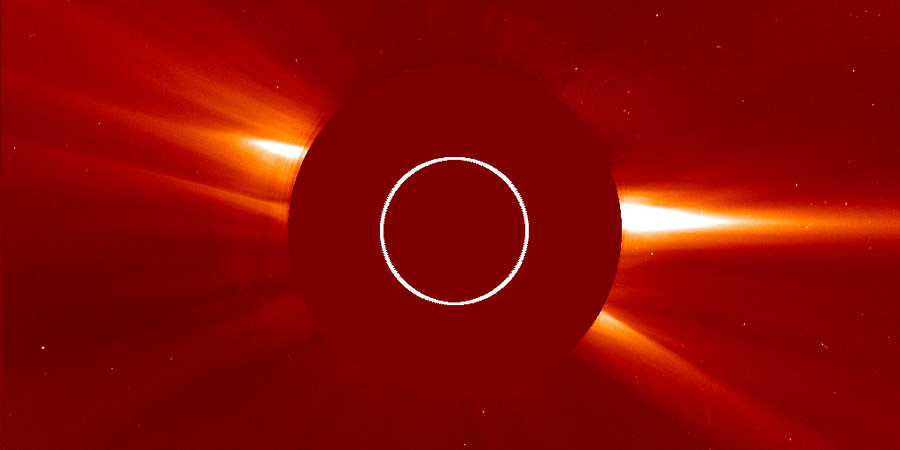
A faint asymmatric full halo coronal mass ejection became visible yesterday on SOHO LASCO coronagraph imagery. There wasn't a very clear source to be found on SDO imagery but a small filament eruption is the primary suspect.
A check to see if this was a front side or a far side eruption with the help of STEREO Ahead coronagraph imagery reveals that this coronal mass ejection indeed came from the earth-facing side of our star and as it is a full halo eruption, it will likely arrive at Earth. The speed of the plasma cloud is estimated to be around 300km/s which is about as fast as the ambient solar wind which will make a clear shock signature hard to detect in the DSCOVR data when the cloud arrives. The strength of the IMF should increase as the plasma cloud passes so be alert for that. The SIDC and the NOAA SWPC both expect the slow moving plasma cloud to arrive this coming Thursday 13 October 2016.

Disturbance storm time index
Since a little while ago we've added the Disturbance storm time index to our website.
This is an index that isn't really know to the general public but it is actually very handy and the NOAA SWPC finally made it available for everyone to use.
The Disturbance Storm Time (Dst) index is a measure of geomagnetic activity used to assess the severity of geomagnetic storms. It is expressed in nanoTeslas and is based on the average value of the horizontal component of the Earth's magnetic field measured at four near-equatorial geomagnetic observatories. It measures the growth and recovery of the ring current in the Earth's magnetosphere. The lower these values get, the more energy is stored in Earth's magnetosphere. Moderate storm conditions start at -50nT. Strong storm conditions at -100nT and hold-on-to-your-hat extreme storming at -250nT.
The graph on the website shows the latest observed Dst reported by the WDC for Geomagnetism from Kyoto, Japan and a short term Dst forecast by the NOAA SWPC.
We are very happy to add the Dst-index to our website and believe it will be of great use for especially our non-European visitors who always had to look up a local magnetometer. Enjoy this new feature and feel free to leave any comments or suggestions!

Thank you for reading this article! Did you have any trouble with the technical terms used in this article? Our help section is the place to be where you can find in-depth articles, a FAQ and a list with common abbreviations. Still puzzled? Just post on our forum where we will help you the best we can!
Current data suggests there is a slight possibility for aurora to appear at the following high latitude regions in the near future
TórshavnOulu
Trondheim
Umeå
Latest news
Latest forum messages
Support SpaceWeatherLive.com!
A lot of people come to SpaceWeatherLive to follow the Sun's activity or if there is aurora to be seen, but with more traffic comes higher server costs. Consider a donation if you enjoy SpaceWeatherLive so we can keep the website online!

Latest alerts
11:09 UTC - Solar flare
Moderate M1.35 flare
10:39 UTC - Radio Blackout
Minor R1 radio blackout in progress (≥M1 - current: M1.03)
Monday, 21 April 2025
20:45 UTC - Geomagnetic activity
Minor G1 geomagnetic storm (Kp5) Threshold Reached: 20:33 UTC
18:57 UTC - Solar flare
Moderate M1.99 flare
18:39 UTC - Radio Blackout
Minor R1 radio blackout in progress (≥M1 - current: M1.93)
Space weather facts
| Last X-flare | 2025/03/28 | X1.1 |
| Last M-flare | 2025/04/22 | M1.3 |
| Last geomagnetic storm | 2025/04/21 | Kp5+ (G1) |
| Spotless days | |
|---|---|
| Last spotless day | 2022/06/08 |
| Monthly mean Sunspot Number | |
|---|---|
| March 2025 | 134.2 -20.4 |
| April 2025 | 120 -14.2 |
| Last 30 days | 112 -28.2 |


