C-class solar flare, Earth-directed CME
Monday, 12 February 2018 14:37 UTC

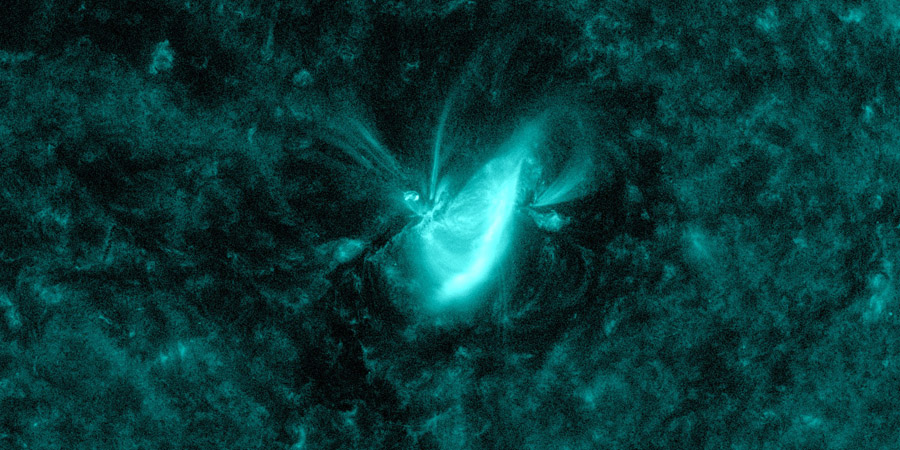
Sunspot region 2699 has been transiting the earth-facing solar disk the past few days but was relatively quiet. However, today just past midnight, this sunspot region started to erupt with a long duration C-class solar flare. The solar flare started at 00:15 UTC and peaked at 01:35 UTC with a maximum measured X-ray flux of C1.5. Not a mighty impressive value but the long duration gave away that this event might have been eruptive...
Following the eruption, coronal dimming was observed which is a classic sign that some ejecta might have been released into space. Considering the location of sunspot region 2699 any ejecta would've likely have an earth-directed component. That brings us to our next tool: the SOHO/LASCO coronagraph imagery.
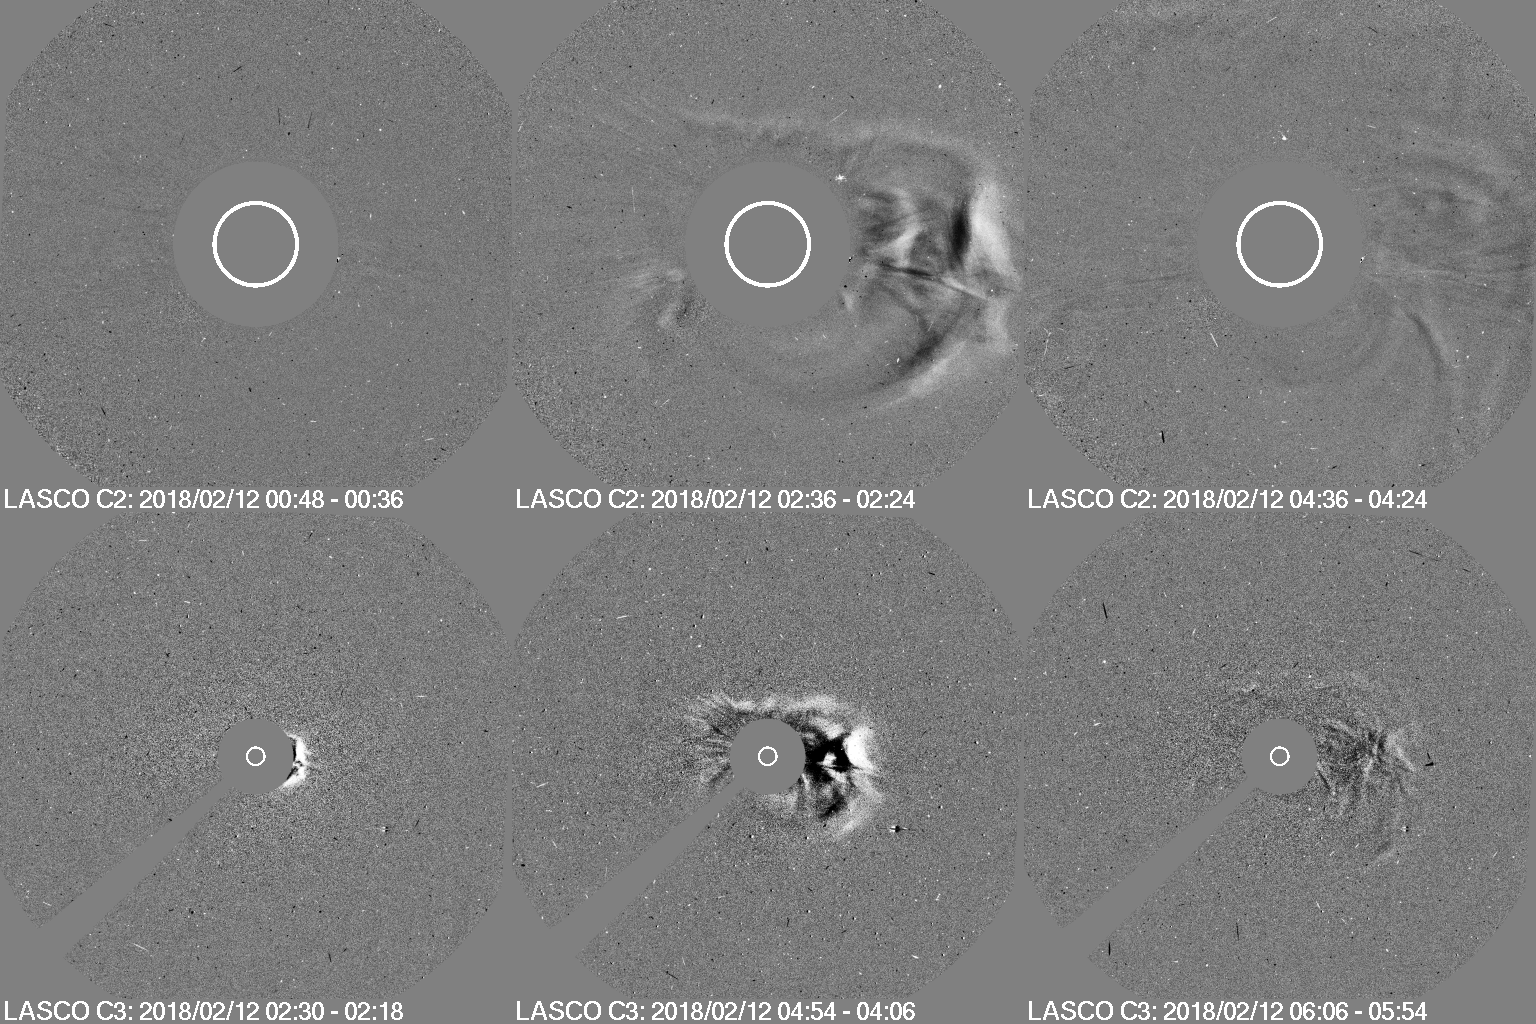
Well, the animation below says it all. The C1.5 solar flare launched an asymmetrical full halo CME which is likely to impact Earth in a few days from now. Most of the ejecta seems to have a trajectory slightly west of our planet but the full halo outline is clear and an impact at our planet is to be expected.
The coronal mass ejection isn't very bright nor is it fast but its a pleasant surprise so close to solar minimum. Note that the word solar minimum is a link. It links to an article from the SIDC about the current solar cycle, do read it as its very interesting! We might be closer to solar minimum than we thought!
But back on topic, we clock the speed of this coronal mass ejection at a fairly slow 500km/s. This gives us a transit time of about 3,5 days calculated with the Drag-Based model. We expect an impact time around 18:00 UTC (+/- 6 hours) on Thursday, 15 February. A minor G1 geomagnetic storm could develop after the coronal mass ejection arrives providing the north-south direction of the IMF (Bz) becomes favourable.

⇧ Animation: SOHO LASCO C2 and C3 difference footage showing the C1.5 coronal mass ejection as it is ejected into space towards our planet.
Thank you for reading this article! Did you have any trouble with the technical terms used in this article? Our help section is the place to be where you can find in-depth articles, a FAQ and a list with common abbreviations. Still puzzled? Just post on our forum where we will help you the best we can!
Latest news
Latest forum messages
Support SpaceWeatherLive.com!
A lot of people come to SpaceWeatherLive to follow the Sun's activity or if there is aurora to be seen, but with more traffic comes higher server costs. Consider a donation if you enjoy SpaceWeatherLive so we can keep the website online!

Latest alerts
Wednesday, 16 April 2025
21:45 UTC - Geomagnetic activity
Minor G1 geomagnetic storm (Kp5) Threshold Reached: 21:36 UTC
21:00 UTC - Geomagnetic activity
Severe G4 geomagnetic storm (Kp8) Threshold Reached: 20:55 UTC
19:45 UTC - Geomagnetic activity
Strong G3 geomagnetic storm (Kp7) Threshold Reached: 19:25 UTC
19:00 UTC - Geomagnetic activity
Moderate G2 geomagnetic storm (Kp6) Threshold Reached: 18:38 UTC
18:45 UTC - Geomagnetic activity
Minor G1 geomagnetic storm (Kp5) Threshold Reached: 18:28 UTC
Space weather facts
| Last X-flare | 2025/03/28 | X1.1 |
| Last M-flare | 2025/04/15 | M1.2 |
| Last geomagnetic storm | 2025/04/16 | Kp8- (G4) |
| Spotless days | |
|---|---|
| Last spotless day | 2022/06/08 |
| Monthly mean Sunspot Number | |
|---|---|
| March 2025 | 134.2 -20.4 |
| April 2025 | 120.7 -13.5 |
| Last 30 days | 120.8 -19.6 |


