Visualizzazione archivio di giovedì, 12 settembre AM
Rapporto attività solare
Ogni brillamento solare menzionato nel rapporto ha un fattore di scala, applicato dal Centro di Predizione Meteorologica Spaziale (SWPC). A causa del fattore di scala del SWPC, i brillamenti solari sono segnalati come ridotti del 42%, rispetto ai dati di qualità scientifica. Il fattore di scala è stato rimosso dai nostri dati archiviati sui brillamenti solari, per riflettere le unità fisiche reali.
Rapporto dell'Attività Geofisica Solare 2002 Sep 12 2200 UTCPreparati dal SWPC della NOAA© ed elaborati da SpaceWeatherLive.com
Rapporto Congiunto USAF/NOAA dell'Attività Solare e Geofisica
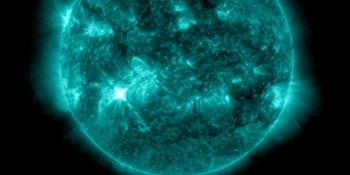
SDF Numero 255 Emesso alle 2200Z il Sep 12 2002IA. Analisi delle Regioni Solari Attive e Attività dalle 2100Z-11 alle 2100Z-12 Solar activity fell to low levels. The largest event
of the period was a C4/Sf flare at 12/0018 UTC from Region 107
(N11E16). Region 105 (S08E16) produced several lesser C-class
flares, including an apparent one in progress at the end of the
period. This region remains the largest on the visible disk. It's
easternmost spots still retain a beta-gamma-delta magnetic
configuration, while the western spot group appears to have lost
some complexity. Region 107 continues in a pattern of slow growth
and frequent flare production. Three new regions were numbered
today, all relatively small and simply structured at present.
IB. Previsione dell'Attività Solare
Solar activity is expected to be low
to moderate for the next three days. M-class activity appears
possible from Regions 105 and 107.
IIA. Sommario dell'Attività Geofisica dalle 2100Z-11 alle 2100Z-12
The geomagnetic field was mainly unsettled to active. One isolated
quiet period was observed at mid-latitudes. Coronal hole high speed
stream effects continued to be the main source of activity.
IIB. Previsione dell'Attività Geofisica
The geomagnetic field is
expected to be quiet to active during the first day of the forecast
period, with a gradual reduction towards quiet to unsettled
conditions thereafter. Greater than 2 MeV electron flux at
geosynchronous orbit may reach high levels during the period.
III. Probabilità dell'Evento dalle Sep del 13 alle Sep del 15
| Classe M | 50% | 50% | 50% |
| Classe X | 05% | 05% | 05% |
| Protone | 05% | 05% | 05% |
| PCAF | green | ||
IV. Flusso di 10.7 cm di Penticton
  Osservato       12 Sep 212
  Previsto   13 Sep-15 Sep  215/220/225
  Media di 90 Giorni        12 Sep 174
V. Indici Geomagnetici A
  Osservato Afr/Ap 11 Sep  016/028
  Stimato     Afr/Ap 12 Sep  013/015
  Previsto    Afr/Ap 13 Sep-15 Sep  012/012-012/012-008/012
VI. Probabilità dell'Attività Geomagnetica dal 13 Sep al 15 Sep
| A. Latitudini Medie | |||
|---|---|---|---|
| Attivo | 25% | 25% | 20% |
| Tempesta minore | 05% | 05% | 01% |
| Tempesta maggiore-grave | 01% | 01% | 01% |
| B. Latitudini Alte | |||
|---|---|---|---|
| Attivo | 30% | 30% | 25% |
| Tempesta minore | 05% | 05% | 05% |
| Tempesta maggiore-grave | 01% | 01% | 01% |
Tutti gli orari in UTC
<< Vai alla pagina della panoramica giornaliera
Ultime notizie
Ultimi messaggi dal forum
Coronal mass ejection impact and G4 geomagnetic storm 10 & 11 October 2024 935AR 3938 21AR 13933 9AR 13932 89AR13936 6
Altri argomentiSupporta SpaceWeatherLive.com!
Molte persone vengono su SpaceWeatherLive per seguire l'attività del Sole o sapere se ci sia la possibilità di vedere l'aurora, ma a maggior traffico corrispondono costi maggiori. Considerate una donazione se vi piace SpaceWeatherLive così che possiamo mantenere online il sito web!

Notizie sul meteo spaziale
| Ultimo brillamento X | 2024/12/08 | X2.2 |
| Ultimo brillamento M | 2024/12/26 | M7.3 |
| Ultima tempesta geomagnetica | 2024/12/17 | Kp5+ (G1) |
| Giorni senza macchie | |
|---|---|
| Ultimo giorno senza macchie | 2022/06/08 |
| Media mensile Numero di Macchie Solari | |
|---|---|
| novembre 2024 | 152.5 -13.9 |
| dicembre 2024 | 119.3 -33.2 |
| Last 30 days | 122 -35.7 |


