Najczęściej zadawane pytania (FAQ)
Jednym z najważniejszych zadań, które mamy tu na SpaceWeatherLive jest to, że nasi goście dowiedzieć się o kosmicznej pogody, gdy odwiedzają naszą stronę internetową. To jest właśnie powód, dla którego mamy dużą część pomocy z wielu artykułów, gdzie kopać głębiej w świecie pogody kosmicznej. Jednak nadal otrzymaliśmy wiele pytań są na SpaceWeatherLive a niektóre z tych pytań wrócić tak często. Pytania, które otrzymaliśmy najczęściej można teraz znaleźć w tym FAQ.
Aktywność słoneczna
Rozbłyski słoneczne mogą się nie tylko drastycznie różnić siłą, ale także czasem trwania. Niektóre rozbłyski słoneczne trwają godzinami, a inne tylko kilka minut. Długotrwałe rozbłyski słoneczne są często (ale nie zawsze!) połączone z wyrzutem plazmy słonecznej. To jest to, co nazywamy wyrzutem masy koronalnej. Rozbłyski słoneczne, które nie trwają zbyt długo (impulsywne), nadal mogą wywołać wyrzut masy koronalnej, ale jest to dość rzadkie, a jeśli już, to te wyrzuty masy koronalnej często nie są tak silne, jak wyrzuty masy koronalnej, które są wywoływane podczas zdarzeń o długim czasie trwania.
Nie ma dokładnego limitu czasu, jaki musi trwać rozbłysk słoneczny, aby można go było zakwalifikować jako zjawisko długotrwałe, ale amerykańska NOAA SWPC klasyfikuje rozbłysk słoneczny jako zjawisko długotrwałe, jeśli nie upłynął jeszcze 30 minut od jego rozpoczęcia.
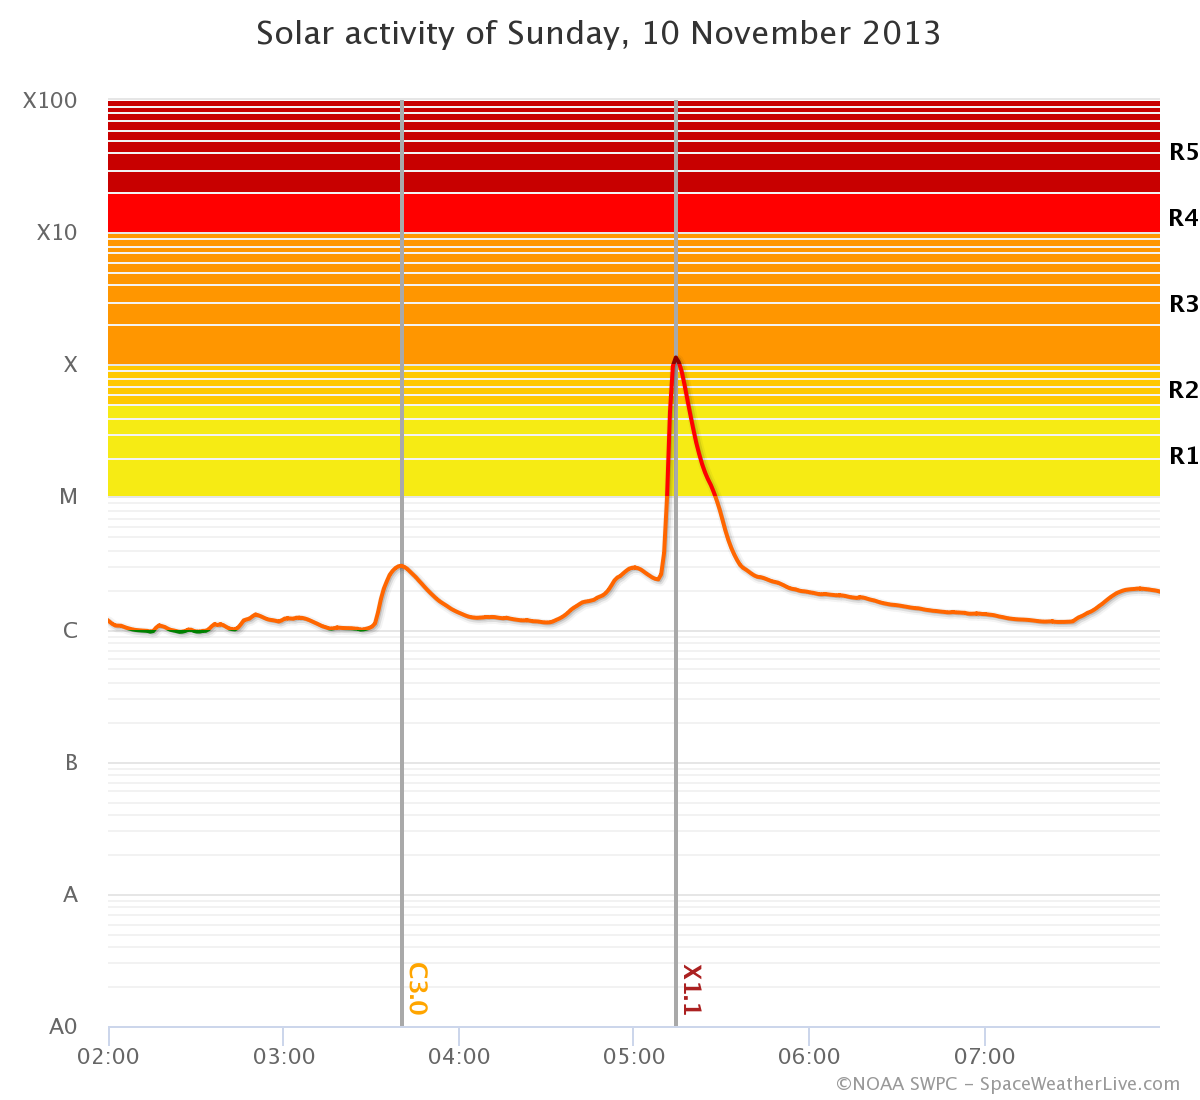
Image: Example of an impulsive solar flare.
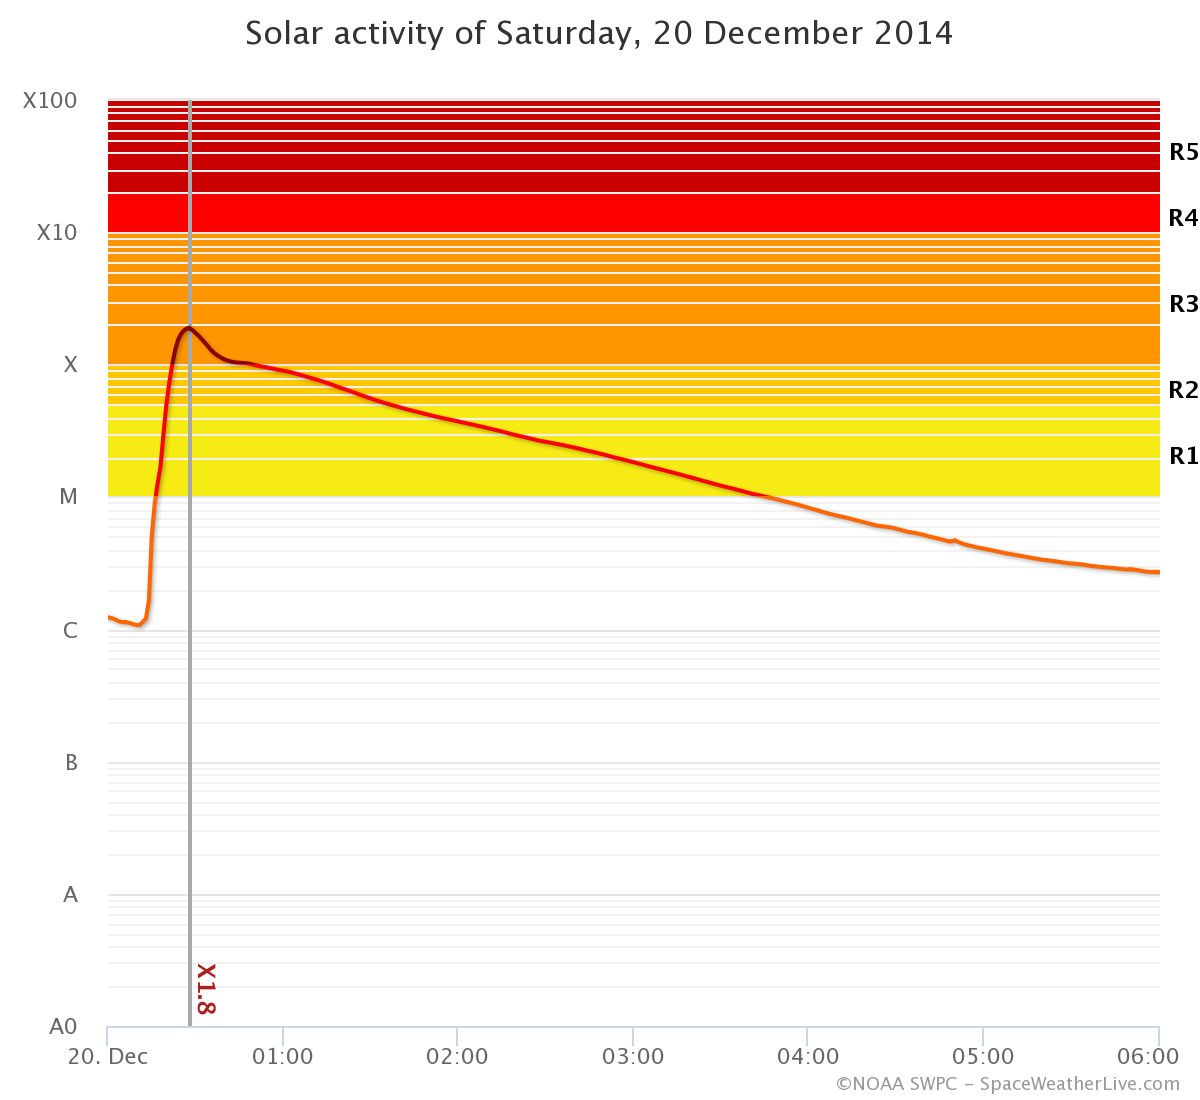
Image: Example of a long duration solar flare.
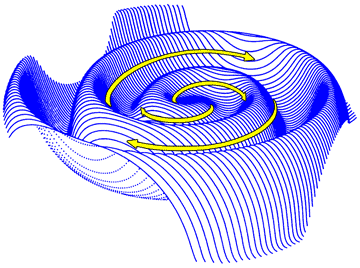
Obraz: Spirala Parkera.
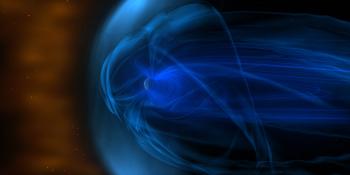
NASA’s Solar Dynamics Observatory is in a geosynchronous orbit around our planet. From there it normally has an uninterrupted view of the Sun. However, twice a year near the equinoxes the Earth blocks SDO’s view of the Sun for a period of time each day. These eclipses are fairly short near the beginning and end of these three week eclipse seasons but ramp up to 72 minutes in the middle. If you see an image from SDO that is completely black then you are likely looking at Earth!
Sometimes you might be lucky enough to see a much smaller object on the images from NASA’s Solar Dynamics Observatory: the Moon! The Moon can also appear on images from NASA’s Solar Dynamics Observatory but it will never block the entire Sun for a very long time like Earth does.
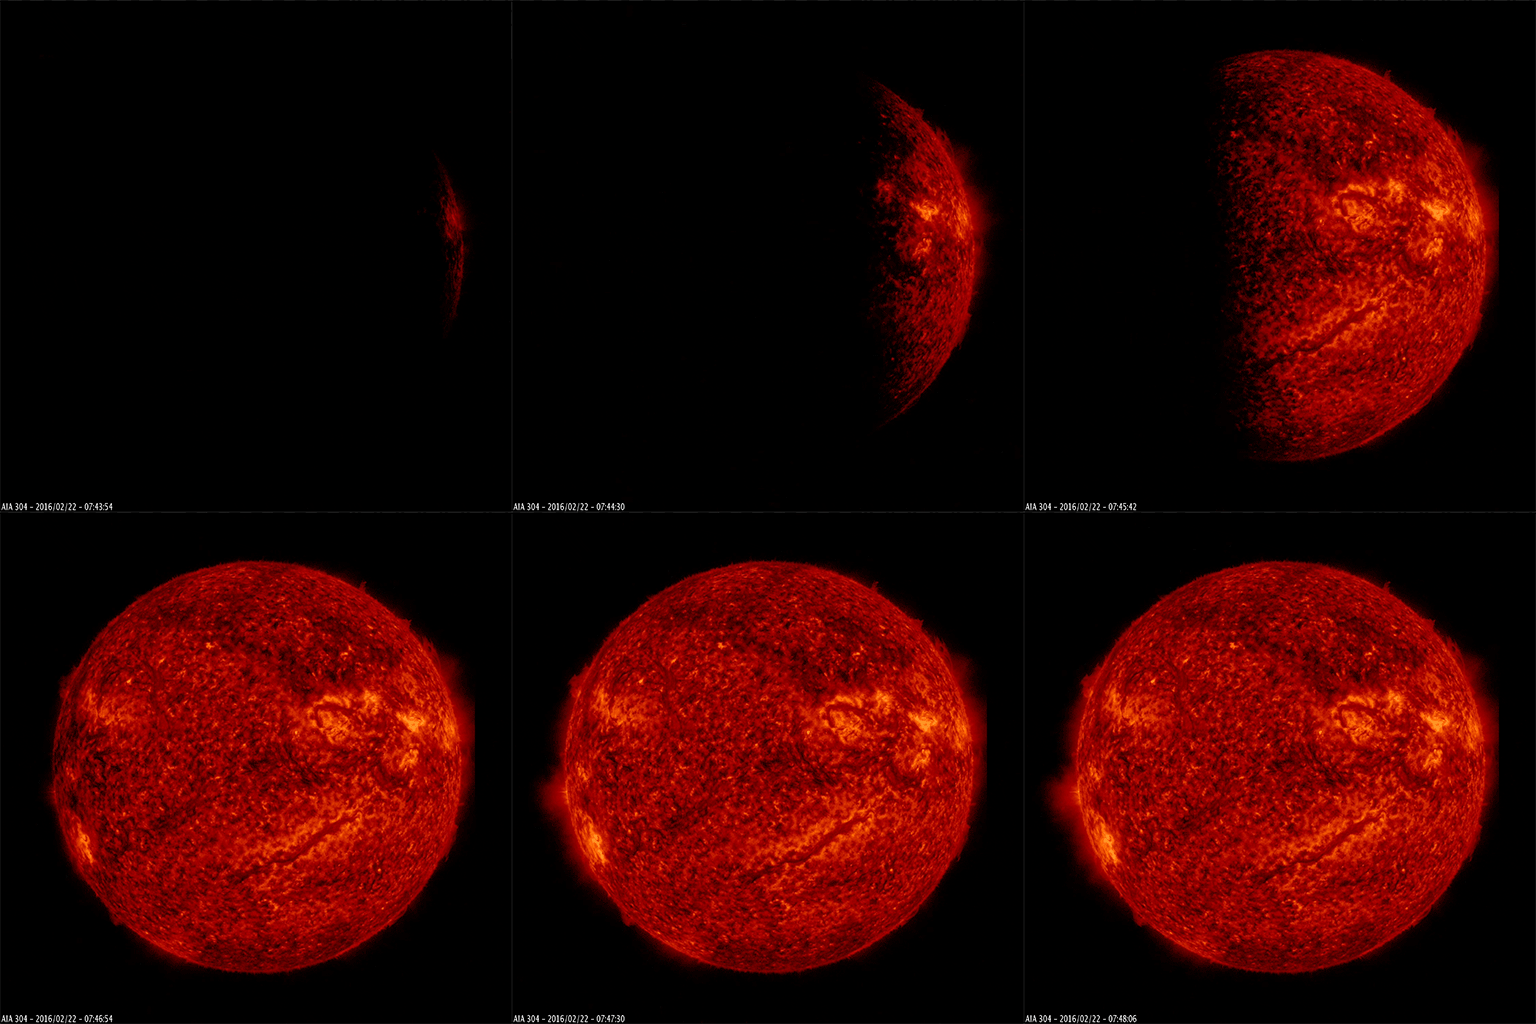
Animation: The Earth blocks SDO’s view of the Sun.
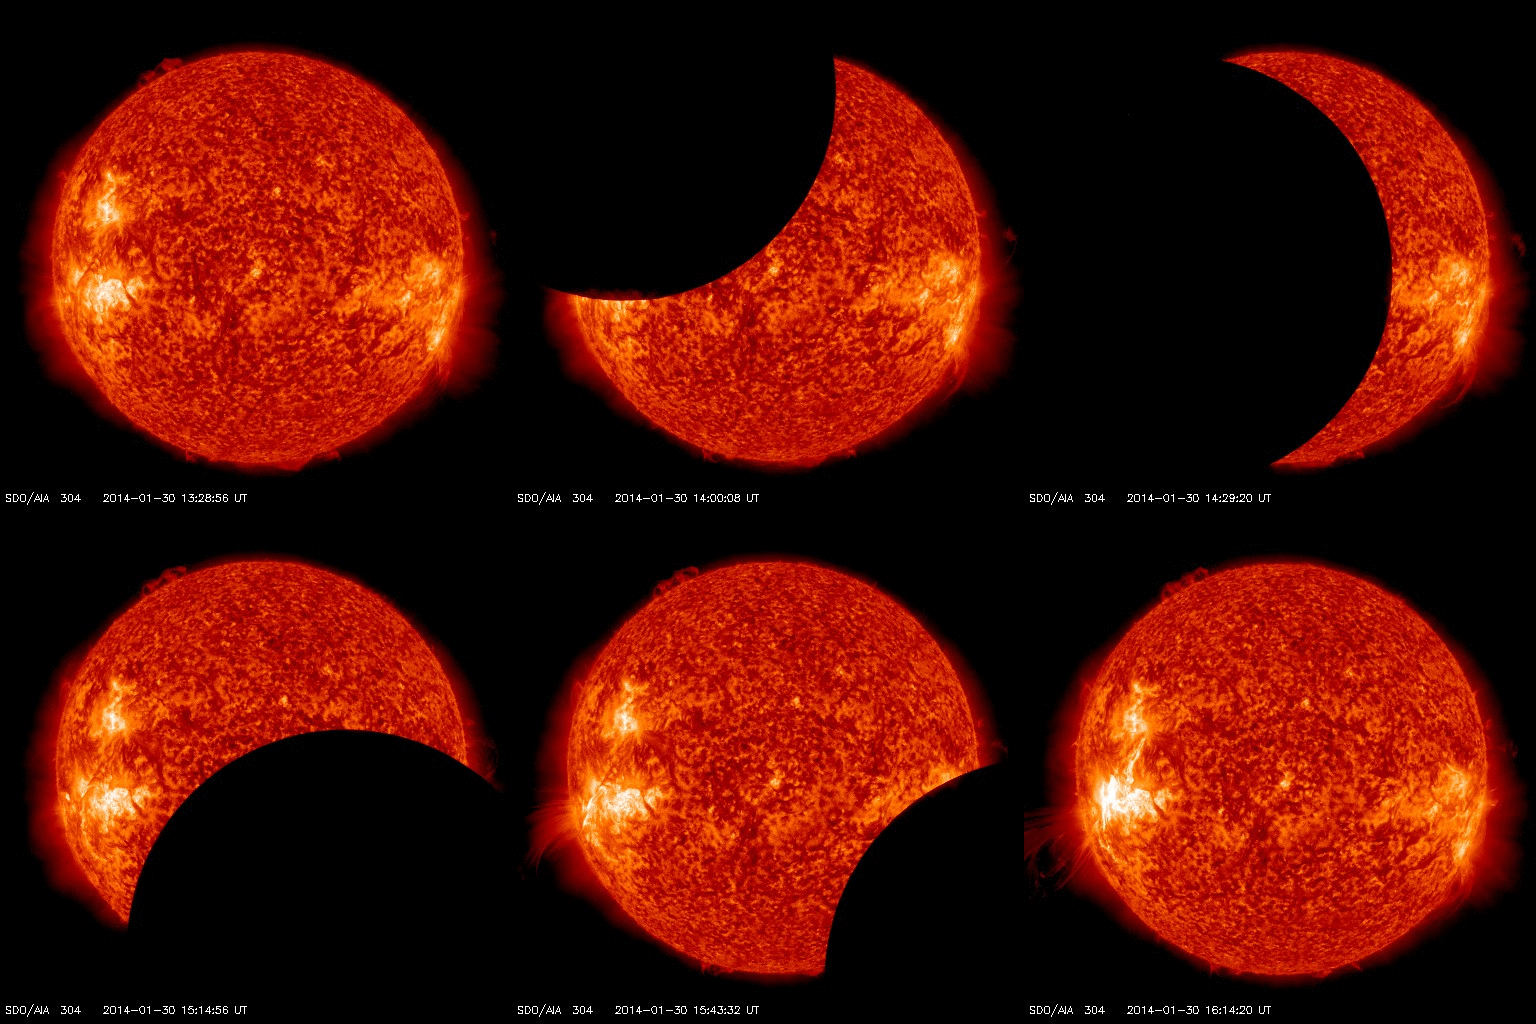
Animation: The Moon blocks SDO’s view of the Sun.
To determine the magnetic polarity of sunspots and a sunspot group’s magnetic classification we use magnetogram imagery from the SDO/HMI instrument. This is a line-of-sight magnetogram even though the magnetic field of the Sun is 3D. This makes it impossible to accurately determine a sunspot region’s magnetic layout near the limbs due to projection effect as the polarity of sunspots seem to change near the limbs.
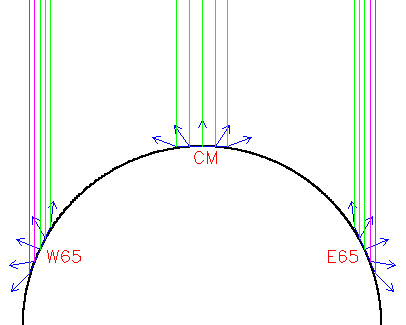
Image: Projection effect.
Difference images are created by subtracting one image from the foregoing picture. This shows what has changed from one frame to the other and are commonly used when analyzing solar events. Coronal mass ejections and their exact trajectory can sometimes be hard to spot using regular imagery making difference imagery often an invaluable tool. Solar eruptions are also much easier to spot and analyze with difference imagery.
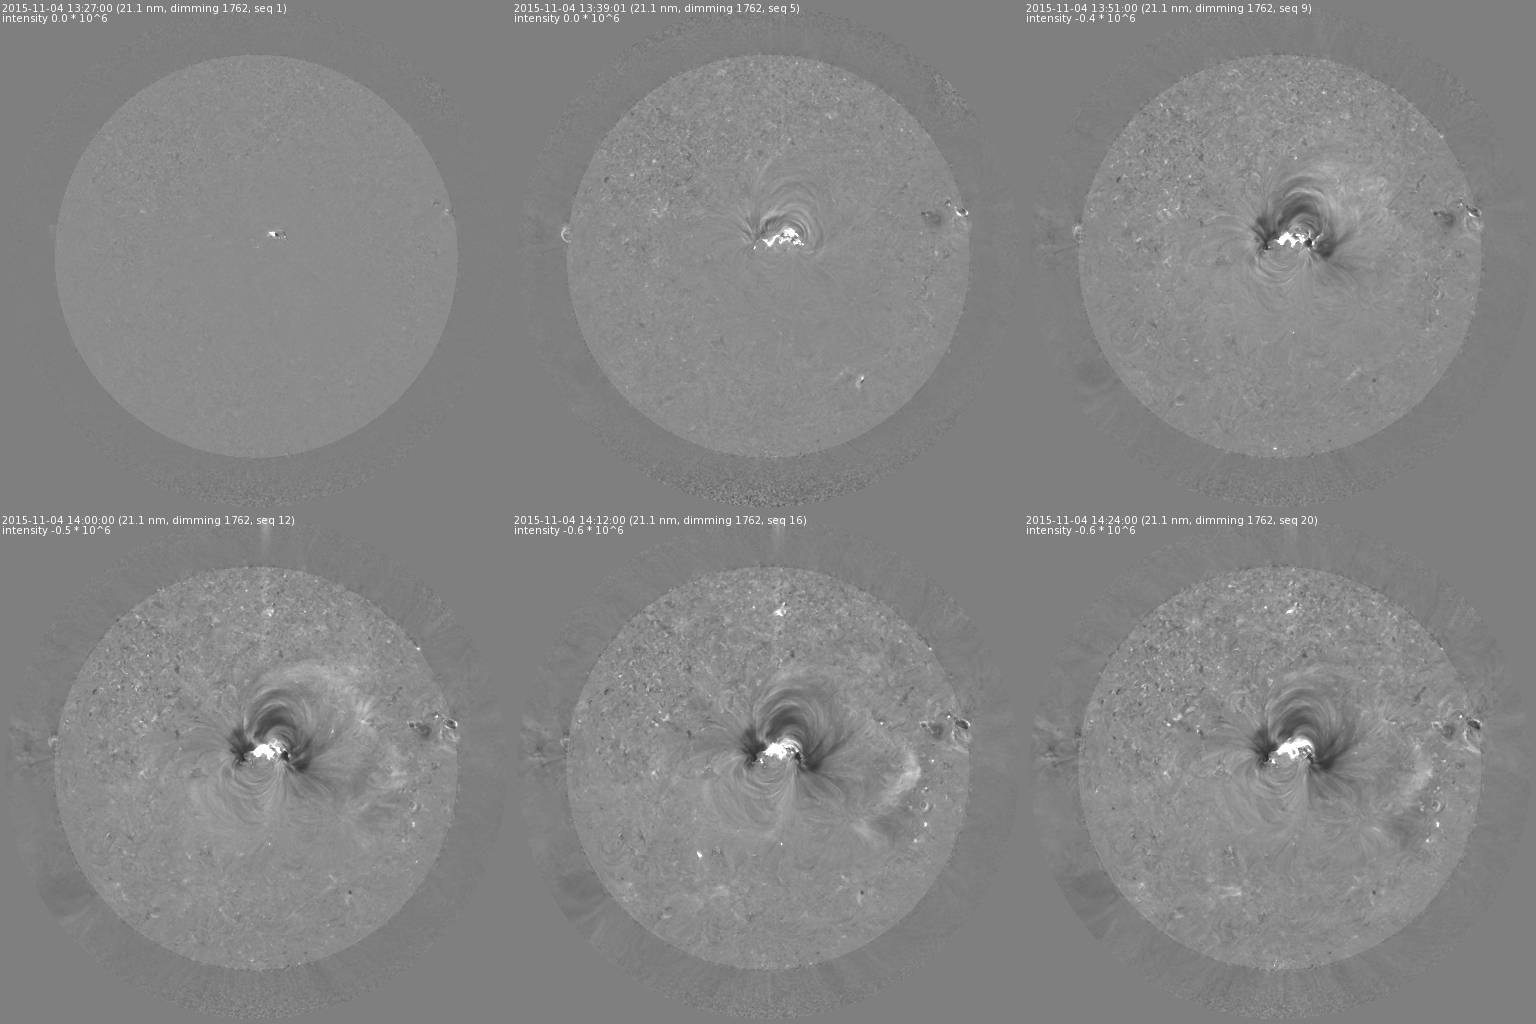
Animation: Difference imagery from SDO of an eruption in 2015.
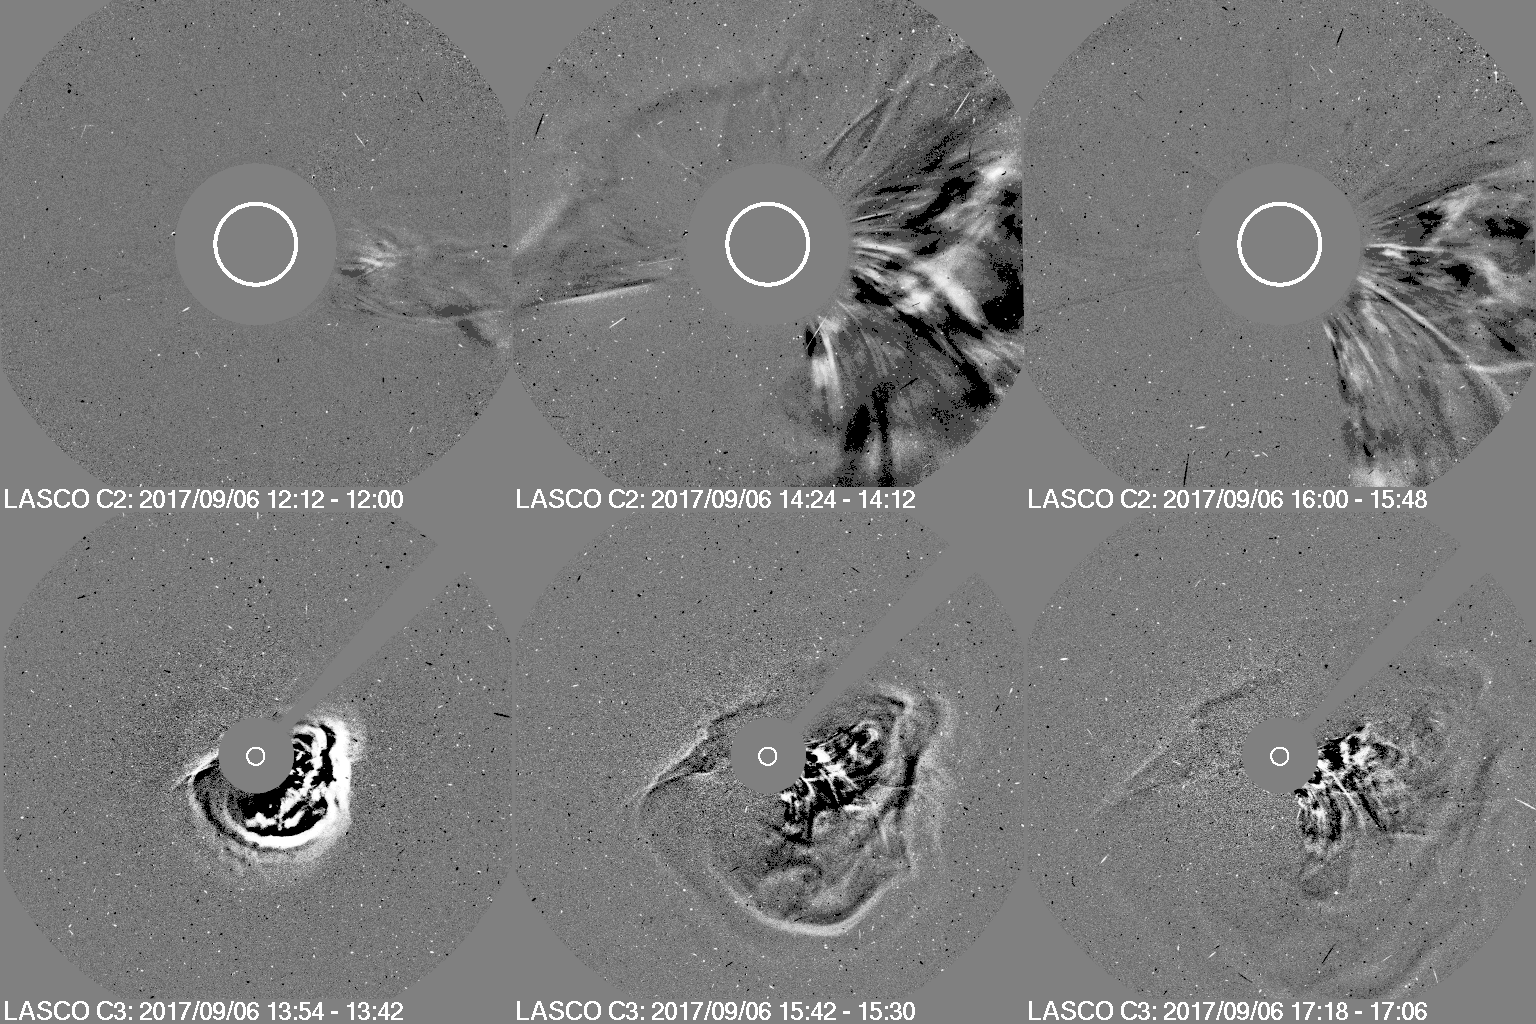
Animation: Difference imagery from SOHO/LASCO of a coronal mass ejection in 2017.
Aktywność zorzowa
Any location on the high latitudes will be able to see auroras with a Kp of 4. For any location on the middle latitudes a Kp-value of 7 is needed. The low latitudes need Kp-values of 8 or 9. The Kp-value that you need of course depends on where you are located on Earth. We made a handy list which is a good guide for what Kp-value you need for any given location within the reach of the auroral ovals.
Important! Note that the locations below give you a reasonable chance to see auroras for the given Kp-index provided local viewing conditions are good. This includes but is not limited to: a clear sight towards the northern or southern horizon, no clouds, no light pollution and complete darkness.
| Kp | Widoczne z |
|---|---|
| 0 | Ameryka Północna: Europa: |
| 1 | Ameryka Północna: Europa: |
| 2 | Ameryka Północna: Europa: |
| 3 | Ameryka Północna: Europa: |
| 4 | Ameryka Północna: Europa: |
| 5 | Ameryka Północna: Europa: Półkula południowa: |
| 6 | Ameryka Północna: Europa: Półkula południowa: |
| 7 | Ameryka Północna: Europa: Półkula południowa: |
| 8 | Ameryka Północna: Europa: Azja: Półkula południowa: |
| 9 | Ameryka Północna: Europa: Azja: Półkula południowa: |
There is no difference between Kp5 and G1. NOAA uses a five-level system called the G-scale, to indicate the severity of both observed and predicted geomagnetic activity. This scale is used to give a quick indication of the severity of a geomagnetic storm. This scale ranges from G1 to G5, with G1 being the lowest level and G5 being the highest level. Conditions below storm level are labelled as G0 but this value is not commonly used. Every G-level has a certain Kp-value associated with it. This ranges from G1 for a Kp-value of 5 to G5 for a Kp-value of 9. The table below will help you with that.
| Skala G | Kp | Aktywność zorzowa | Średnia częstotliwość |
|---|---|---|---|
| G0 | 4 i niższe | Poniżej poziomu burzy | |
| G1 | 5 | Słaba burza | 1700 na cykl (900 dni na cykl) |
| G2 | 6 | Średni burzy | 600 na cykl (360 dni na cykl) |
| G3 | 7 | Silna burza | 200 na cykl (130 dni na cykl) |
| G4 | 8 | Bardzo silna burza | 100 na cykl (60 dni na cykl) |
| G5 | 9 | Ekstremalne burzy | 4 na cykl (4 dni na cykl) |
Inne pytania
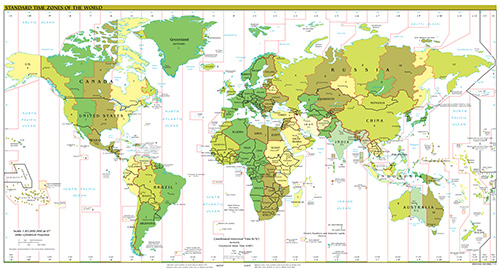
Ziemia ma około 24 stref czasowych. Mówimy "około" dlatego, że niektóre kraje lub regiony używają czasu lokalnego zbaczającego o pół godziny od tych stref czasowych. Jednakże, kiedy mówimy o pogodzie kosmicznej lub o nauce ogólnej obchodzi nas jedna strefa czasowa Koordynowany czas uniwersalny (UTC). Znajdziesz ten czas wszędzie na naszej stronie. Urzyj mapy poniżej by zobaczyć różnice pomiędzy strefą czasową UTC i strefą czasową w której ty się znajdujesz. Kliknij na obrazek by ujrzeć powiększoną wersję.
Obraz: Standardowe strefy czasowe świata. Source: Wikimedia Commons.
Przyjrzyjmy się kilku przykładom: wyobraź sobie, że jesteś w Vancouver, Kanada w Pacyficznej strefie czasu standardowego. Według czasu UTC to jest UTC 21. By przekształcić czas UTC do twojego czasu lokalnego musisz odjąć 8 godzin od czasu UTC. 21 odjąć 8 się równa czasu lokalnego 13 PST. Podczas czasu letniego (Pacific Daylight Time) Odejmujemy 7 godzin od czasu UTC i to równa się czasu lokalnemu 14 PDT.
Let's try again but this time we are in Amsterdam, the Netherlands. To convert 21 UTC to our local time we add 1 hour and that results in a local time of 22h. During daylight saving time we add 2 hours and that results in a local time of 23h.
Do keep in mind the date when converting UTC to your local time. We once again take Vancouver, Canada as an example: it currently is 14 November, 02h UTC time. This results in 18h on 13 November local time in Vancouver, Canada.
SpaceWeatherLive does offer a way to change the UTC time to your local time on the interactive graphs like the solar wind and solar flare graphs. You do this by tapping on the clock which you can find both on the website and app. This will change the times displayed on the interactive graphs to your local time or back from your local time to the UTC time.
Informacje o SpaceWeatherLive
Aplikacja SpaceWeatherLive
You can get rid of the ads in the SpaceWeatherLive app by going to the menu, press settings and press remove ads. This will bring you to a page where you can remove the ads by purchasing a subscription for 1 month, 6 months or 1 year. This will remove all the ads in your Android or iOS SpaceWeatherLive app for the time period you have chosen and support SpaceWeatherLive along the way!Strona SpaceWeatherLive
On our subsite SpaceWeatherLive Pro you can enjoy an ad-free experience. A SpaceWeatherLive Community account is required with an active subscription on 'SpaceWeatherLive Pro' or 'SpaceWeatherLive Pro Light' to be able to visit the ad-free SpaceWeatherLive Pro site.Forum społecznościowe SpaceWeatherLive
A subscription to remove ads can also be purchased on our community forum for an ad free experience there, it's also included with the 'SpaceWeatherLive Pro' subscription. This will also provide your account with unlimited storage for attachments and likes.Aktualne dane sugerują, że istnieje niewielkie prawdopodobieństwo pojawienia się zorzy polarnej w następujących regionach o wysokiej szerokości geograficznej w najbliższej przyszłości
Gillam, MB, Iqaluit, NUNuuk
Najnowsze wiadomości
Najnowsze wiadomości z forum
Wesprzyj SpaceWeatherLive.com!
Wielu ludzi odwiedza SpaceWeatherLive aby śledzić aktywność słoneczną lub sprawdzić czy jest szansa na zaobserwowanie zorzy polarnej. Niestety, większy ruch na stronie oznacza większe koszty utrzymania serwera. Dlatego, jeśli jesteś zadowolony ze strony SpaceWeatherLive, zachęcamy do wspierania nas finansowo. Dzięki temu będziemy mogli utrzymać naszą stronę.

Alerty
02:30 UTC - Indeks mocy półkuli
Model OVATION przewiduje, że index mocy półkuli osiągnie 50GW o 03:23 UTC
środa, 16 kwietnia 2025
21:45 UTC - Aktywność geomagnetyczna
Słaba burza geomagnetyczna G1 (Kp5) osiągnięty próg: 21:36 UTC
21:00 UTC - Aktywność geomagnetyczna
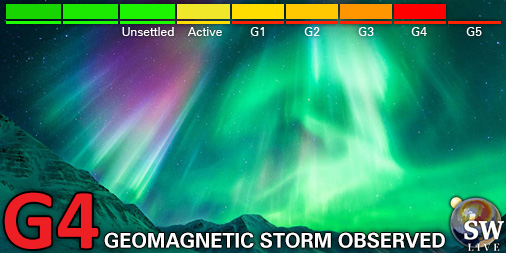
Bardzo silna burza geomagnetyczna G4 (Kp8) osiągnięty próg: 20:55 UTC
19:45 UTC - Aktywność geomagnetyczna
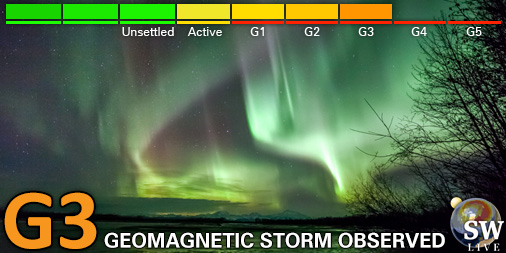
Silna burza geomagnetyczna G3 (Kp7) Osiągnięto próg: 19:25 UTC
19:00 UTC - Aktywność geomagnetyczna
Umiarkowana burza geomagnetyczna G2 (Kp6) Osiągnięto próg: 18:38 UTC
Fakty na temat pogody kosmicznej
| Ostatnie rozbłyski klasy X | 2025/03/28 | X1.1 |
| Ostatnie rozbłyski klasy M | 2025/04/15 | M1.2 |
| Ostatnia burza geomagnetyczna | 2025/04/16 | Kp8- (G4) |
| Dni bez plam słonecznych | |
|---|---|
| Ostatni dzień bez skazy | 2022/06/08 |
| Średnia miesięczna liczba plam słonecznych | |
|---|---|
| marca 2025 | 134.2 -20.4 |
| kwietnia 2025 | 120.7 -13.5 |
| Ostatnie 30 dni | 118.3 -22.1 |
