Co to są rozbłyski słoneczne?
A solar flare is basically a giant explosion on the surface of our Sun which occurs when magnetic field lines from sunspots tangle and erupt. A solar flare is defined as a sudden, rapid, and intense variation in brightness. A solar flare occurs when magnetic energy that has built up in the solar atmosphere is suddenly released. Material is heated to many millions of degrees in just minutes and radiation is emitted across virtually the entire electromagnetic spectrum, from radio waves at the long wavelength end, through optical emission to X-rays and gamma rays at the short wavelength end. The amount of energy released is equivalent to millions of nuclear bombs exploding all at the same time! Solar flares are an often occurrence when the Sun is active in the years around solar maximum. Many solar flares can occur on just one day during this period! Around solar minimum, solar flares might occur less than once per week. Large flares are less frequent than smaller ones. Some (mostly stronger) solar flares can launch huge clouds of solar plasma into space which we call a coronal mass ejection. When a coronal mass ejection arrives at Earth, it can cause a geomagnetic storm and intense auroral displays.

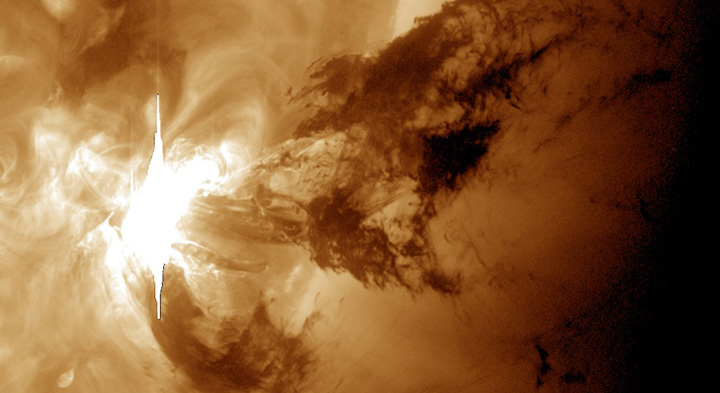
Obraz: A spectacular solar flare as seen by the NASA's Solar Dynamics Observatory in the 193 Ångström wavelength.
Klasyfikacja rozbłysków słonecznych
Solar flares are classified as A, B, C, M or X according to the peak flux (in watts per square metre, W/m²) of 1 to 8 Ångströms X-rays near Earth, as measured by XRS instrument on-board the GOES satellite which is in a geostationary orbit over the Pacific Ocean. The table below shows us the different solar flare classes:
| Klasa | W/m² between 1 & 8 Ångströms |
|---|---|
| A | <10-7 |
| B | ≥10-7 <10-6 |
| C | ≥10-6 <10-5 |
| M | ≥10-5 <10-4 |
| X | ≥10-4 |
Each X-ray class is logarithmic, with each class being 10 times stronger than the previous one, and within each category ranging from 1 to 9. For example: B1 to B9, C1 to C9, etc. Originally the classes where limited to C, M and X. As instruments over the subsequent years became more sensitive, smaller flares could be observed which were than labeled as A and B. Similarly, Y and Z could follow X if X10 or stronger flares were detected, but these have never been used. Instead scientist continued the X-class for labeling very large flares (for example the X40 of November 4th 2003 and not Y4)
Rozbłyski słoneczne klasy A i B
The A & B-class are the lowest class of solar flares. They are very common and not very interesting. The background flux (amount of radiation emitted when there are no flares) is often in the B-range during solar maximum and in the A-range during solar minimum.
Rozbłyski słoneczne klasy C
Rozbłyski klasy C są niewielkimi rozbłyskami słonecznymi, które mają niewielki lub żaden wpływ na Ziemi. Tylko rozbłyski słoneczne klasy C, które trwają długo mogą wyrzucić koronalny wyrzut masy, ale są zazwyczaj wolne, słabe i rzadko powodują znaczące geomagnetyczne zaburzenia na ziemi. Strumień tła (ilość promieniowania emitowanego gdy nie ma rozbłysków) może znajdować się w dolnym zakresie klasy C, gdy skomplikowany magnetycznie region plam słonecznych zwraca się w stronę ziemi.
Rozbłyski słoneczne klasy M
M-class solar flares are what we call the medium large solar flares. They cause small (R1) to moderate (R2) radio blackouts on the daylight side of the Earth. Some eruptive M-class solar flares can also cause solar radiation storms. Strong, long duration M-class solar flares are likely candidates to launch a coronal mass ejection. If the solar flare takes place near the center of the Earth-facing solar disk and launches a coronal mass ejection towards our planet, there is a high probability that the resulting geomagnetic storm is going to be strong enough for aurora on the middle latitudes.
Rozbłyski słoneczne klasy X
Rozbłyski klasy X są największymi oraz najsilniejszymi rozbłyskami. Średnio rozbłysk słoneczny tej wielkości występuje 10 razy na rok i są częstsze podczas maksimum słonecznego niż minimum słonecznego. Silne po ekstremalne (R3-R5) awarie radiowe występują po dziennej stronie podczas rozbłysku słonecznego. Jeśli rozbłysk słoneczny jest eruptywny i ma miejsce w pobliżu środka zwróconego ku ziemi, może spowodować silną i długotrwałą burzę promieniowania słonecznego i wyrzucić koronalny wyrzut masy może spowodować poważne (G4) do ekstremalnych (G5) burz Magnetycznych na Ziemi.

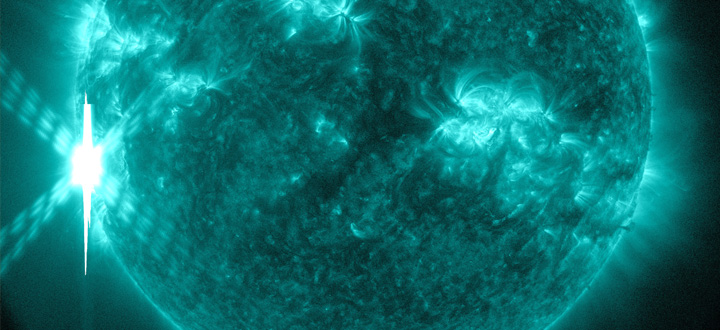
Obraz: An X-class solar flare as seen by NASA's Solar Dynamics Observatory in the 131 Ångström wavelength.
So what's above X9? The X-class continues after X9 instead of getting a new letter and these solar flares are often referred to as ''Super X-class'' solar flares. Solar flares that reach or even surpass the X10 class are however very rare and occur only a few times during a solar cycle. It is actually a good thing that these powerful solar flares do not occur so often as the consequences on Earth could be severe. The coronal mass ejections which can be launched by such solar flares are known to be able to cause issues with our modern technology like satellites and power lines.
One thing to note with super X-class flares is that an X20 solar flare is not 10 times as strong as an X10 solar flare. An X10 solar flares equals an X-ray flux of 0.001 Watts/m² while an X20 solar flare equals 0.002 Watts/m² in the 1-8 Ångstrom wavelength.
The largest solar flare ever recorded since satellites started to measure them in 1976 was estimated to be an X40 solar flare which occurred on November 4th, 2003 during Solar Cycle 23. The XRS long channel on the GOES-12 satellite was saturated at X24.86 for 12 minutes by the intense radiation. A later analysis of the available data yield an estimated peak flux of X40 however there are scientists who think that this solar flare was even stronger than X40. A good thing for us was that the sunspot group which produced this solar flare had already rotated largely of the Earth-facing solar disk when the X40 solar flare occurred. A thing to note is that there has not been a solar flare that saturated the XRS channels since the new generation of GOES satellites but it is expected that it will saturate at about the same flux levels.
High Frequency (HF) radio blackouts caused by solar flares
Bursts of X-ray and Extreme Ultra Violet radiation which are emitted during solar flares and can cause problems with High Frequency (HF) radio transmissions on the sunlit side of the Earth and are most intense at locations where the Sun is directly overhead. It is mostly High Frequency (HF) (3-30 MHz) radio communication that is affected during such events, although fading and diminished reception may spill over to Very High Frequency (VHF) (30-300 MHz) and higher frequencies.
These blackouts are a result of enhanced electron densities in the lower ionosphere (D-layer) during a solar flare which causes a large increase in the amount of energy radio waves lose when it passes through this layer. This process prevents the radio waves from reaching the much higher E, F1 and F2 layers where these radio signals normally refract and bounce back to Earth.
Radio blackouts caused by solar flares are the most common space weather events to affect Earth and also the fastest to affect us. Minor events occur about 2000 times each solar cycle. The electromagnetic emission produced during flares travels at the speed of light taking just over 8 minutes to travel from the Sun to Earth. These type of radio blackouts can last from several minutes to several hours depending on the duration of the solar flare. How severe a radio blackout is depends on the strength of the solar flare.
The Highest Affected Frequency (HAF) during an X-ray radio blackout during local noon is based on the current X-ray flux value between the 1-8 Ångström. The Highest Affected Frequency (HAF) can be derived by a formula. Below you will find a table where you can see what the Highest Affected Frequency (HAF) is during a specific X-ray flux.
| GOES X-ray class & flux | Najwyższa dotknięta częstotliwość |
|---|---|
| M1.0 (10-5) | 15 MHz |
| M5.0 (5×10⁻⁵) | 20 MHz |
| X1.0 (10-4) | 25 MHz |
| X5.0 (5×10⁻⁴) | 30 MHz |
Skala R
NOAA uses a five-level system called the R-scale, to indicate the severity of a X-ray related radio blackout. This scale ranges from R1 for a minor radio blackout event to R5 for an extreme radio blackout event, with R1 being the lowest level and R5 being the highest level. Every R-level has a certain X-ray brightness associated with it. This ranges from R1 for a X-ray flux of M1 to R5 for a X-ray flux of X20. On Twitter we provide alerts as soon as a certain radio blackout threshold has been reached. Because each blackout level represents a certain GOES X-ray brightness, you can associate these alerts directly with a solar flare that is occurring at that moment. We can define the following radio blackout classes:
| Skala R | Opis | GOES X-ray threshold by class & flux | Średnia częstotliwość |
|---|---|---|---|
| R1 | Słaba | M1 (10-5) | 2000 na cykl (950 dni na cykl) |
| R2 | Umiarkowany | M5 (5×10⁻⁵) | 350 na cykl (300 dni na cykl) |
| R3 | Silny | X1 (10-4) | 175 na cykl (140 dni na cykl) |
| R4 | Znacząca | X10 (10-3) | 8 na cykl (8 dni na cykl) |
| R5 | Ekstremalny | X20 (2×10⁻³) | Mniej niż 1 na cykl |
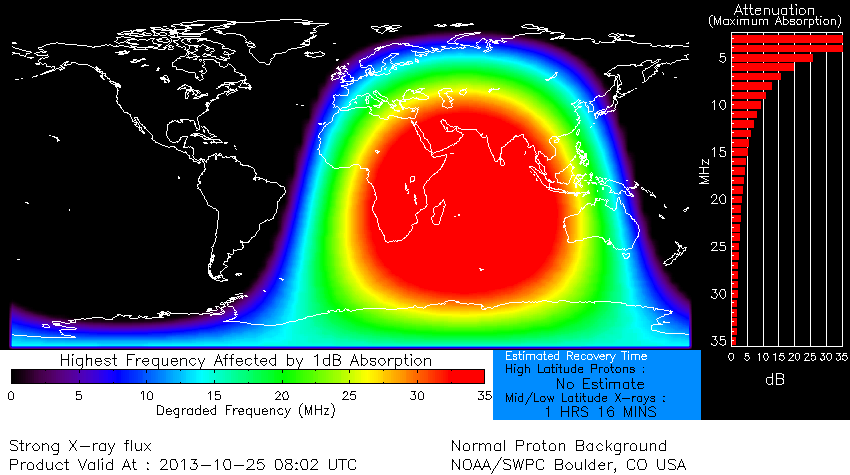
The image below shows the effects of an X1 (R3-strong) solar flare on the sunlit side of the Earth. We can see that the Highest Affected Frequency (HAF) is about 25 MHz there where the Sun is directly overhead. Radio frequencies lower than the HAF suffer an even greater loss.

Obraz: NOAA SWPC - D Region Absorption Product. The D-region absorption prediction model is used as a guide to understand the high frequency (HF) radio degradation and communication interruptions that this can cause.
Najnowsze wiadomości
Najnowsze wiadomości z forum
Wesprzyj SpaceWeatherLive.com!
Wielu ludzi odwiedza SpaceWeatherLive aby śledzić aktywność słoneczną lub sprawdzić czy jest szansa na zaobserwowanie zorzy polarnej. Niestety, większy ruch na stronie oznacza większe koszty utrzymania serwera. Dlatego, jeśli jesteś zadowolony ze strony SpaceWeatherLive, zachęcamy do wspierania nas finansowo. Dzięki temu będziemy mogli utrzymać naszą stronę.

Fakty na temat pogody kosmicznej
| Ostatnie rozbłyski klasy X | 2025/03/28 | X1.1 |
| Ostatnie rozbłyski klasy M | 2025/04/15 | M1.2 |
| Ostatnia burza geomagnetyczna | 2025/04/16 | Kp8- (G4) |
| Dni bez plam słonecznych | |
|---|---|
| Ostatni dzień bez skazy | 2022/06/08 |
| Średnia miesięczna liczba plam słonecznych | |
|---|---|
| marca 2025 | 134.2 -20.4 |
| kwietnia 2025 | 120.5 -13.7 |
| Ostatnie 30 dni | 118.3 -22.1 |


