Viewing archive of Monday, 15 July 2002
Solar activity report
Any mentioned solar flare in this report has a scaling factor applied by the Space Weather Prediction Center (SWPC). Because of the SWPC scaling factor, solar flares are reported as 42% smaller than for the science quality data. The scaling factor has been removed from our archived solar flare data to reflect the true physical units.
Report of Solar-Geophysical Activity 2002 Jul 15 2200 UTCPrepared by the NOAA © SWPC and processed by SpaceWeatherLive.com
Joint USAF/NOAA Report of Solar and Geophysical Activity
SDF Number 196 Issued at 2200Z on 15 Jul 2002IA. Analysis of Solar Active Regions and Activity from 14-2100Z to 15-2100Z
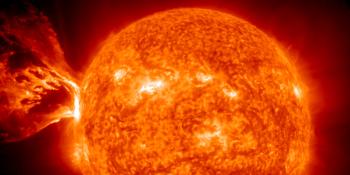
Solar activity increased to high levels. Region 30
(N18W00) produced an X3/3b flare at 15/2008UTC associated with a
1900 sfu Tenflare, a Type IV radio sweep, and a magnetic crochet
(based on Boulder USGS magnetometer data). This region also produced
frequent C-class flares including a C9/Sf at 15/1155 UTC associated
with a Type II radio sweep. Region 30 showed significant growth in
its trailer spots during the past few days including the formation
of multiple magnetic delta configurations. The remaining active
regions were unremarkable. New Regions 35 (S09E63) and 36 (S07E76)
were numbered.
IB. Solar Activity Forecast
Solar activity is expected to be
moderate. Region 30 is likely to produce isolated M-class flares.
Region 30 could also produce another major flare during the period.
IIA. Geophysical Activity Summary 14-2100Z to 15-2100Z
Geomagnetic field activity has been at quiet to unsettled levels.
IIB. Geophysical Activity Forecast
Geomagnetic field activity is
expected to increase to quiet to active levels on 16 July due to
recurrent coronal hole effects. Activity may increase to active to
minor storm levels on 17 July following today's X-flare. A greater
than 10 MeV proton event is expected to begin early on 16 July, also
due to today's X-flare.
III. Event Probabilities 16 Jul to 18 Jul
| Class M | 75% | 75% | 75% |
| Class X | 15% | 15% | 15% |
| Proton | 50% | 10% | 10% |
| PCAF | Red | ||
IV. Penticton 10.7 cm Flux
  Observed       15 Jul 160
  Predicted   16 Jul-18 Jul  160/165/170
  90 Day Mean        15 Jul 161
V. Geomagnetic A Indices
  Observed Afr/Ap 14 Jul  001/006
  Estimated     Afr/Ap 15 Jul  005/006
  Predicted    Afr/Ap 16 Jul-18 Jul  012/012-020/020-012/012
VI. Geomagnetic Activity Probabilities 16 Jul to 18 Jul
| A. Middle Latitudes | |||
|---|---|---|---|
| Active | 30% | 40% | 35% |
| Minor storm | 15% | 20% | 15% |
| Major-severe storm | 05% | 10% | 05% |
| B. High Latitudes | |||
|---|---|---|---|
| Active | 35% | 45% | 40% |
| Minor storm | 20% | 25% | 20% |
| Major-severe storm | 10% | 15% | 10% |
All times in UTC
Latest news

Tuesday, 15 April 2025
CME arrival, G3 storm watch
Friday, 28 March 2025
X1.1 solar flare

Monday, 24 March 2025
Coronal hole faces Earth
Latest forum messages
AR4073 1AR 4065 13Ask your obscure/"stupid" space weather questions. 376AR4064 29Filaments and prominences 106
More topicsSupport SpaceWeatherLive.com!
A lot of people come to SpaceWeatherLive to follow the Sun's activity or if there is aurora to be seen, but with more traffic comes higher server costs. Consider a donation if you enjoy SpaceWeatherLive so we can keep the website online!

Latest alerts
Thursday, 24 April 2025
07:27 UTC - Hemispheric Power Index
The OVATION model predicts the Hemispheric Power Index to reach 50GW at 08:15 UTC
07:15 UTC - Geomagnetic activity
Active geomagnetic conditions (Kp4) Threshold Reached: 07:03 UTC

06:27 UTC - Coronal mass ejection arrival
CME impact detected - Current Solar Wind Speed 644km/sec - IMF: Bt (strength): 15nT & Bz: 0nT (South).

Space weather facts
| Last X-flare | 2025/03/28 | X1.1 |
| Last M-flare | 2025/04/22 | M1.3 |
| Last geomagnetic storm | 2025/04/21 | Kp5+ (G1) |
| Spotless days | |
|---|---|
| Last spotless day | 2022/06/08 |
| Monthly mean Sunspot Number | |
|---|---|
| March 2025 | 134.2 -20.4 |
| April 2025 | 122.8 -11.4 |
| Last 30 days | 117.7 -15.6 |