Viewing archive of Saturday, 10 March 2012
Solar activity report
Any mentioned solar flare in this report has a scaling factor applied by the Space Weather Prediction Center (SWPC). Because of the SWPC scaling factor, solar flares are reported as 42% smaller than for the science quality data. The scaling factor has been removed from our archived solar flare data to reflect the true physical units.
Report of Solar-Geophysical Activity 2012 Mar 10 2200 UTCPrepared by the NOAA © SWPC and processed by SpaceWeatherLive.com
Joint USAF/NOAA Report of Solar and Geophysical Activity
SDF Number 070 Issued at 2200Z on 10 Mar 2012IA. Analysis of Solar Active Regions and Activity from 09-2100Z to 10-2100Z Solar activity was high. Region 1430 (N21W42) produced
a C8 flare at 10/1552Z and Region 1429 (N18W26) produced a long
duration M8 flare at 10/1744Z with an associated Tenflare (459 sfu)
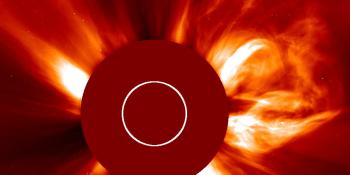
and a Type IV radio sweep. Both flares had associated CMEs. The
first CME appeared in SOHO/LASCO C2 imagery at 10/1624Z with
the majority of the ejecta off the NW limb. The second CME,
associated with the M8 flare, first appeared in C2 imagery at
10/1800Z. Further analysis will be done as imagery becomes
available, however initial analysis indicated the event produced a
full-halo CME with an estimated plane-of-sky speed between 1200 -
1400 km/s. Region 1429 remained a large Ekc spot class with a
Beta-Gamma-Delta magnetic class. A new region appeared on the ENE
limb near Region 1432 (N16E52). Close proximity to the limb made a
detailed analysis of this new region difficult.
IB. Solar Activity Forecast
Solar activity is expected to be at
moderate to high levels for the forecast period (11 - 13 March).
IIA. Geophysical Activity Summary 09-2100Z to 10-2100Z
The geomagnetic field was at quiet to minor storm levels with periods
of major storming at higher latitudes between 10/0600 - 1200Z.
Activity was due to the continued effects of the 07 March CME.
Solar wind speed at the ACE spacecraft has gradually decreased from
approximately 580 km/s to near 450 km/s. The greater than 10 MeV
and greater than 100 Mev proton events are on going. The greater
than 2 MeV electron flux at geosynchronous orbit was at high levels
throughout the period.
IIB. Geophysical Activity Forecast
The geomagnetic field is
expected to be quiet to unsettled early on day 1 (11 March) until
the arrival of the 09 March CME followed by todays CME associated
with the M8 flare. Models show an arrival of the first CME early to
midday on 11 March which is expected to cause minor to major storm
conditions with isolated severe storm periods likely. Initial
estimates on the second CME indicate an arrival late on day 1.
Activity is expected to continue into day 2 (12 March) with minor to
major storm conditions with isolated severe storm periods possible.
Conditions are expected to decrease to unsettled to active levels by
day 3 (13 March).
III. Event Probabilities 11 Mar to 13 Mar
| Class M | 80% | 80% | 80% |
| Class X | 40% | 40% | 40% |
| Proton | 99% | 99% | 60% |
| PCAF | red | ||
IV. Penticton 10.7 cm Flux
  Observed       10 Mar 149
  Predicted   11 Mar-13 Mar  155/155/155
  90 Day Mean        10 Mar 125
V. Geomagnetic A Indices
  Observed Afr/Ap 09 Mar  057/094
  Estimated     Afr/Ap 10 Mar  013/018
  Predicted    Afr/Ap 11 Mar-13 Mar  047/085-024/040-007/012
VI. Geomagnetic Activity Probabilities 11 Mar to 13 Mar
| A. Middle Latitudes | |||
|---|---|---|---|
| Active | 30% | 25% | 15% |
| Minor storm | 35% | 30% | 05% |
| Major-severe storm | 35% | 25% | 01% |
| B. High Latitudes | |||
|---|---|---|---|
| Active | 05% | 15% | 25% |
| Minor storm | 15% | 25% | 15% |
| Major-severe storm | 75% | 55% | 10% |
All times in UTC
Latest news
Latest forum messages
Incoming & Unnumbered Active Regions 1351Power transmission for all of us. And why I believe we are better prepared than ever for major solar events 7Unspecified geomagnetic activity 1747Strong far side CME 322jsoc 64
More topicsSupport SpaceWeatherLive.com!
A lot of people come to SpaceWeatherLive to follow the Sun's activity or if there is aurora to be seen, but with more traffic comes higher server costs. Consider a donation if you enjoy SpaceWeatherLive so we can keep the website online!

Space weather facts
| Last X-flare | 2024/12/08 | X2.2 |
| Last M-flare | 2024/12/22 | M1.0 |
| Last geomagnetic storm | 2024/12/17 | Kp5+ (G1) |
| Spotless days | |
|---|---|
| Last spotless day | 2022/06/08 |
| Monthly mean Sunspot Number | |
|---|---|
| November 2024 | 152.5 -13.9 |
| December 2024 | 103.3 -49.2 |
| Last 30 days | 115.4 -40.8 |


