M2.3 solar flare
Saturday, 2 January 2016 09:02 UTC
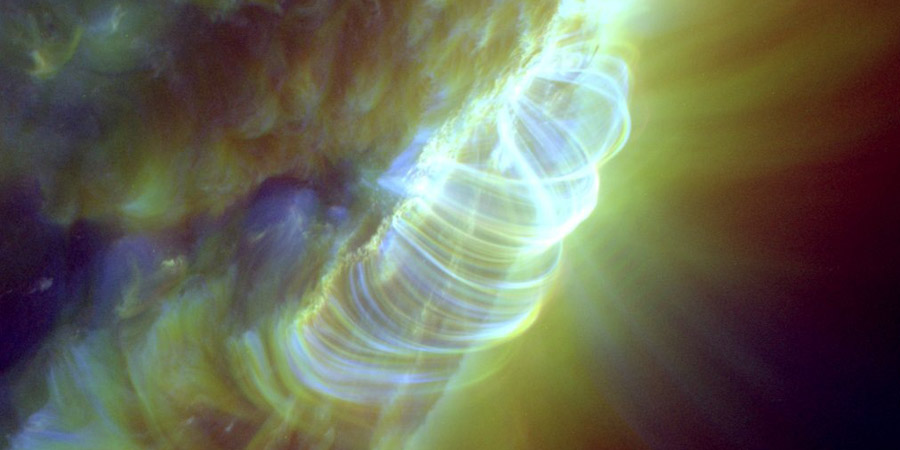
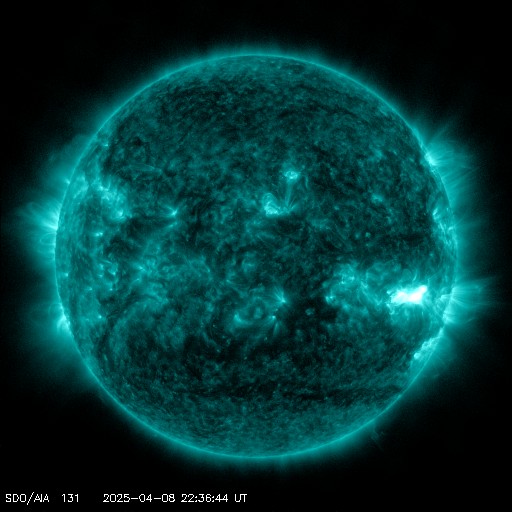
A long duration M2.3 solar flare (R1-minor) took place around sunspot region 2473 near the west limb and peaked today at 00:11 UTC.
Moderately strong M2.39 solar #flare from #sunspot region 12473 - Follow live on https://t.co/6H0obRsbUC pic.twitter.com/7x2X0l7D1m
— SpaceWeatherLive (@_SpaceWeather_) 2 januari 2016
ALERT: Type IV Radio Emission
Begin Time: 2016 Jan 01 2324 UTC
ALERT: Type II Radio Emission
Begin Time: 2016 Jan 01 2322 UTC
Estimated Velocity: 1019 km/s
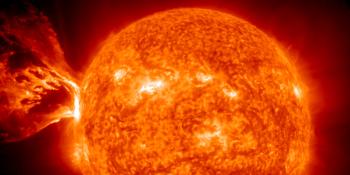
This solar flare was highly eruptive and launched a partial halo coronal mass ejection of the west limb which is unlikely to hit Earth. It also caused a minor S1 solar radiation storm which causes HF radio issues through polar regions.
Animation: the partial halo coronal mass ejection launched by today M2.3 solar flare.
Thank you for reading this article! Did you have any trouble with the technical terms used in this article? Our help section is the place to be where you can find in-depth articles, a FAQ and a list with common abbreviations. Still puzzled? Just post on our forum where we will help you the best we can!
Current data suggests there is a slight possibility for aurora to appear at the following high latitude regions in the near future
Gillam, MB, Iqaluit, NUNuuk
Tórshavn
Reykjavik
Latest news
X1.1 solar flare

Coronal hole faces Earth
Strong G3 geomagnetic storm watch for 23 March
Latest forum messages
Support SpaceWeatherLive.com!
A lot of people come to SpaceWeatherLive to follow the Sun's activity or if there is aurora to be seen, but with more traffic comes higher server costs. Consider a donation if you enjoy SpaceWeatherLive so we can keep the website online!

Latest alerts
01:45 UTC - Geomagnetic activity
Active geomagnetic conditions (Kp4) Threshold Reached: 01:41 UTC

Wednesday, 9 April 2025
08:12 UTC - Hemispheric Power Index
The OVATION model predicts the Hemispheric Power Index to reach 76GW at 08:57 UTC
02:00 UTC - Geomagnetic activity
Minor G1 geomagnetic storm (Kp5) Threshold Reached: 01:45 UTC

Tuesday, 8 April 2025
23:57 UTC - Hemispheric Power Index
The OVATION model predicts the Hemispheric Power Index to reach 50GW at 00:44 UTC
22:42 UTC - Solar flare
Moderate M1.57 flare
Space weather facts
| Last X-flare | 2025/03/28 | X1.1 |
| Last M-flare | 2025/04/08 | M1.5 |
| Last geomagnetic storm | 2025/04/06 | Kp5 (G1) |
| Spotless days | |
|---|---|
| Last spotless day | 2022/06/08 |
| Monthly mean Sunspot Number | |
|---|---|
| March 2025 | 134.2 -20.4 |
| April 2025 | 148.6 +14.4 |
| Last 30 days | 139.3 +3.1 |