Viewing archive of Tuesday, 9 July 2002
Solar activity report
Any mentioned solar flare in this report has a scaling factor applied by the Space Weather Prediction Center (SWPC). Because of the SWPC scaling factor, solar flares are reported as 42% smaller than for the science quality data. The scaling factor has been removed from our archived solar flare data to reflect the true physical units.
Report of Solar-Geophysical Activity 2002 Jul 09 2200 UTCPrepared by the NOAA © SWPC and processed by SpaceWeatherLive.com
Joint USAF/NOAA Report of Solar and Geophysical Activity
SDF Number 190 Issued at 2200Z on 09 Jul 2002IA. Analysis of Solar Active Regions and Activity from 08-2100Z to 09-2100Z
Solar activity was moderate. Two M-class events (an
M2.3 at 08/2320 UTC, and an M1.0 at 09/0905 UTC) along with a C8.6
event (at 09/0413 UTC) all occurred from an apparent emergent source
near the northwest limb. Associated activity in this area was
evident in SOHO/EIT imagery and in H-alpha imagery from the IPS
Culgoora observatory. Other activity included an unusual tenflare
(250 sfu at 09/1858 UTC) that occurred without notable x-ray
enhancement. However, a possible source was evident in an
impressive backside full-halo CME, seen in SOHO/LASCO imagery at
09/1931 UTC. New Region 30 (N18E74) rotated into view and was
numbered today. This large, bipolar region was the likely source of
yesterday's M-class event.
IB. Solar Activity Forecast
Solar activity is expected to be low
to moderate for the next three days.
IIA. Geophysical Activity Summary 08-2100Z to 09-2100Z
The geomagnetic field was quiet to active. Isolated active periods
occurred in apparent response to gradually increasing solar wind
speed and periods of southward IMF.
IIB. Geophysical Activity Forecast
The geomagnetic field is
expected to be mainly quiet to unsettled for the next three days.
Isolated active conditions may occur late in the period in response
to an expected onset of high speed stream effects from a coronal
hole.
III. Event Probabilities 10 Jul to 12 Jul
| Class M | 35% | 35% | 35% |
| Class X | 01% | 01% | 01% |
| Proton | 05% | 05% | 05% |
| PCAF | green | ||
IV. Penticton 10.7 cm Flux
  Observed       09 Jul 136
  Predicted   10 Jul-12 Jul  135/140/135
  90 Day Mean        09 Jul 166
V. Geomagnetic A Indices
  Observed Afr/Ap 08 Jul  006/010
  Estimated     Afr/Ap 09 Jul  013/014
  Predicted    Afr/Ap 10 Jul-12 Jul  010/010-008/008-010/008
VI. Geomagnetic Activity Probabilities 10 Jul to 12 Jul
| A. Middle Latitudes | |||
|---|---|---|---|
| Active | 15% | 10% | 15% |
| Minor storm | 05% | 01% | 05% |
| Major-severe storm | 01% | 01% | 01% |
| B. High Latitudes | |||
|---|---|---|---|
| Active | 20% | 15% | 15% |
| Minor storm | 05% | 05% | 05% |
| Major-severe storm | 01% | 01% | 01% |
All times in UTC
Current data suggests there is a slight possibility for aurora to appear at the following high latitude regions in the near future
Gillam, MB, Whitehorse, YT, Yellowknife, NTLatest news
Latest forum messages
More topicsSupport SpaceWeatherLive.com!
A lot of people come to SpaceWeatherLive to follow the Sun's activity or if there is aurora to be seen, but with more traffic comes higher server costs. Consider a donation if you enjoy SpaceWeatherLive so we can keep the website online!

Latest alerts
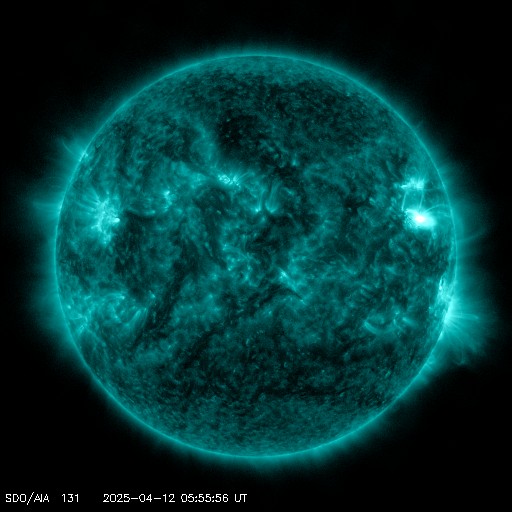
06:09 UTC - Solar flare
Moderate M1.27 flare
05:51 UTC - Radio Blackout
Minor R1 radio blackout in progress (≥M1 - current: M1.16)
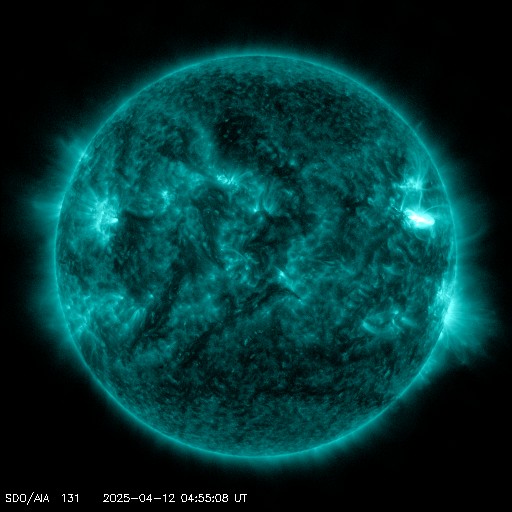
05:03 UTC - Solar flare
Moderate M1.19 flare
04:48 UTC - Radio Blackout
Minor R1 radio blackout in progress (≥M1 - current: M1.17)
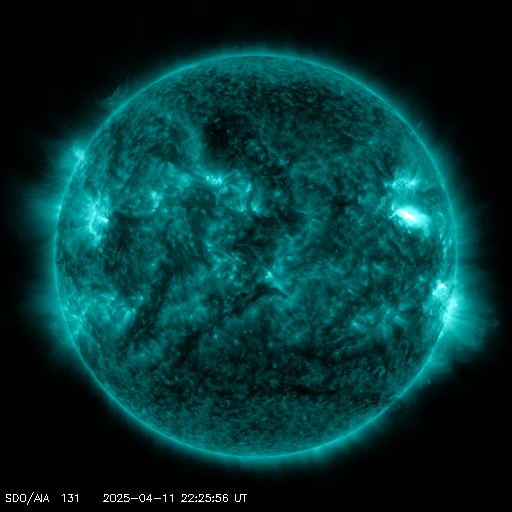
Friday, 11 April 2025
22:39 UTC - Solar flare
Moderate M1.05 flare
Space weather facts
| Last X-flare | 2025/03/28 | X1.1 |
| Last M-flare | 2025/04/11 | M1.0 |
| Last geomagnetic storm | 2025/04/06 | Kp5 (G1) |
| Spotless days | |
|---|---|
| Last spotless day | 2022/06/08 |
| Monthly mean Sunspot Number | |
|---|---|
| March 2025 | 134.2 -20.4 |
| April 2025 | 139.5 +5.3 |
| Last 30 days | 136.6 -3.5 |


