Viewing archive of Monday, 2 December 2002
All times in UTC
Current data suggests there is a moderate possibility for aurora to appear at the following middle latitude regions in the near future
YakutskCurrent data suggests there is a slight possibility for aurora to appear at the following low latitude regions in the near future
Krasnoyarsk, NovosibirskLatest news
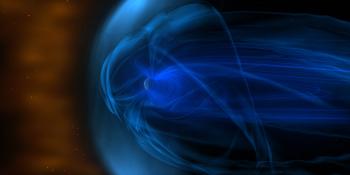
CME arrival, G3 storm watch
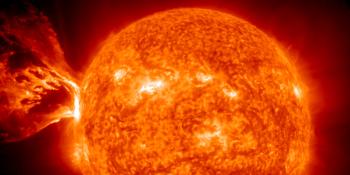
X1.1 solar flare

Coronal hole faces Earth
Latest forum messages
Support SpaceWeatherLive.com!
A lot of people come to SpaceWeatherLive to follow the Sun's activity or if there is aurora to be seen, but with more traffic comes higher server costs. Consider a donation if you enjoy SpaceWeatherLive so we can keep the website online!

Latest alerts
15:30 UTC - Geomagnetic activity
Minor G1 geomagnetic storm (Kp5) Threshold Reached: 15:20 UTC

14:30 UTC - Geomagnetic activity
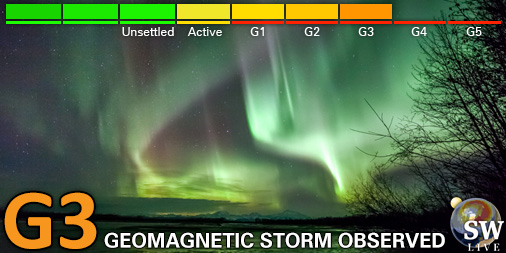
Strong G3 geomagnetic storm (Kp7) Threshold Reached: 14:18 UTC
13:30 UTC - Geomagnetic activity
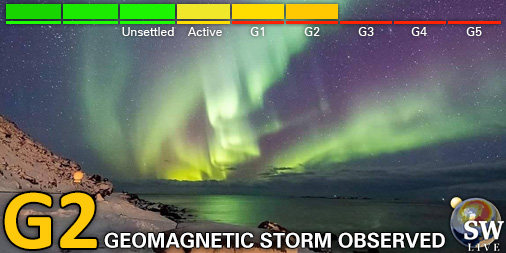
Moderate G2 geomagnetic storm (Kp6) Threshold Reached: 13:21 UTC
13:18 UTC - Hemispheric Power Index
The OVATION model predicts the Hemispheric Power Index to reach 125GW at 14:01 UTC
13:15 UTC - Geomagnetic activity
Minor G1 geomagnetic storm (Kp5) Threshold Reached: 13:13 UTC

Space weather facts
| Last X-flare | 2025/03/28 | X1.1 |
| Last M-flare | 2025/04/15 | M1.2 |
| Last geomagnetic storm | 2025/04/15 | Kp6+ (G2) |
| Spotless days | |
|---|---|
| Last spotless day | 2022/06/08 |
| Monthly mean Sunspot Number | |
|---|---|
| March 2025 | 134.2 -20.4 |
| April 2025 | 124.1 -10.1 |
| Last 30 days | 124.7 -16.6 |