Viewing archive of Tuesday, 16 July 2013
Solar activity report
Any mentioned solar flare in this report has a scaling factor applied by the Space Weather Prediction Center (SWPC). Because of the SWPC scaling factor, solar flares are reported as 42% smaller than for the science quality data. The scaling factor has been removed from our archived solar flare data to reflect the true physical units.
Report of Solar-Geophysical Activity 2013 Jul 16 2200 UTCPrepared by the NOAA © SWPC and processed by SpaceWeatherLive.com
Joint USAF/NOAA Report of Solar and Geophysical Activity
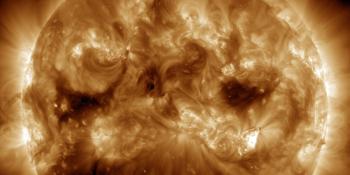
SDF Number 197 Issued at 2200Z on 16 Jul 2013IA. Analysis of Solar Active Regions and Activity from 15-2100Z to 16-2100Z
Solar activity has been at low levels for the past 24 hours.
The largest solar event of the period was a C2 event observed at
16/0110Z from Region 1791 (S14W08). There are currently 3 numbered
sunspot regions on the disk.
IB. Solar Activity Forecast
Solar activity is likely to be low with a
chance for M-class flares on days one, two, and three (17 Jul, 18 Jul,
19 Jul).
IIA. Geophysical Activity Summary 15-2100Z to 16-2100Z
The geomagnetic
field has been at quiet levels for the past 24 hours. Solar wind speed,
as measured by the ACE spacecraft, reached a peak speed of 406 km/s at
15/2120Z. Electrons greater than 2 MeV at geosynchronous orbit reached a
peak level of 1690 pfu.
IIB. Geophysical Activity Forecast
The geomagnetic field is expected
to be at quiet to unsettled levels on day one (17 Jul) and unsettled to
active levels on days two and three (18 Jul, 19 Jul).
III. Event Probabilities 17 Jul to 19 Jul
| Class M | 25% | 25% | 25% |
| Class X | 01% | 01% | 01% |
| Proton | 01% | 01% | 01% |
| PCAF | green | ||
IV. Penticton 10.7 cm Flux
  Observed       16 Jul 114
  Predicted   17 Jul-19 Jul 115/120/125
  90 Day Mean        16 Jul 121
V. Geomagnetic A Indices
  Observed Afr/Ap 15 Jul  033/035
  Estimated     Afr/Ap 16 Jul  006/007
  Predicted    Afr/Ap 17 Jul-19 Jul  009/010-011/015-011/015
VI. Geomagnetic Activity Probabilities 17 Jul to 19 Jul
| A. Middle Latitudes | |||
|---|---|---|---|
| Active | 20% | 35% | 35% |
| Minor storm | 05% | 15% | 15% |
| Major-severe storm | 01% | 01% | 01% |
| B. High Latitudes | |||
|---|---|---|---|
| Active | 20% | 10% | 10% |
| Minor storm | 30% | 30% | 30% |
| Major-severe storm | 25% | 50% | 50% |
All times in UTC
Current data suggests there is a slight possibility for aurora to appear at the following high latitude regions in the near future
Oulu, Rovaniemi, Sodankylä, UtsjokiKirkenes
Arkhangelsk, Murmansk, Norilsk, Vorkuta
Kiruna, Luleå
The solar wind speed is currently moderately high (604.9 km/sec.)
The density of the solar wind is moderate (23.56 p/cm3)
The density of the solar wind is moderate (23.56 p/cm3)
Latest news

Monday, 24 March 2025
Coronal hole faces Earth
Saturday, 22 March 2025
Strong G3 geomagnetic storm watch for 23 March

Wednesday, 5 March 2025
Coronal hole faces Earth
Latest forum messages
Large Coronal Hole 25 108Photographing auroras 32AR4043 8More on an art than a science 3Space Weather Memes 689
More topicsSupport SpaceWeatherLive.com!
A lot of people come to SpaceWeatherLive to follow the Sun's activity or if there is aurora to be seen, but with more traffic comes higher server costs. Consider a donation if you enjoy SpaceWeatherLive so we can keep the website online!

Latest alerts
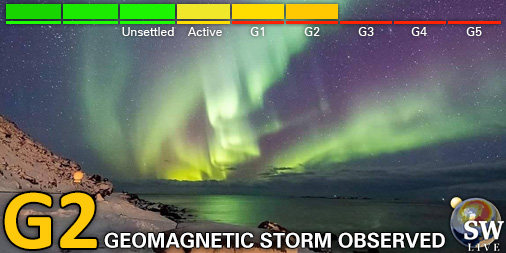
18:00 UTC - Geomagnetic activity
Moderate G2 geomagnetic storm (Kp6) Threshold Reached: 17:00 UTC

17:00 UTC - Geomagnetic activity
Minor G1 geomagnetic storm (Kp5) Threshold Reached: 16:28 UTC

14:15 UTC - Geomagnetic activity
Moderate G2 geomagnetic storm (Kp6) Threshold Reached: 13:58 UTC
12:18 UTC - Hemispheric Power Index
The OVATION model predicts the Hemispheric Power Index to reach 75GW at 13:21 UTC
11:54 UTC - Hemispheric Power Index
The OVATION model predicts the Hemispheric Power Index to reach 51GW at 12:57 UTC
Space weather facts
| Last X-flare | 2025/02/23 | X2.0 |
| Last M-flare | 2025/03/26 | M1.0 |
| Last geomagnetic storm | 2025/03/22 | Kp6- (G2) |
| Spotless days | |
|---|---|
| Last spotless day | 2022/06/08 |
| Monthly mean Sunspot Number | |
|---|---|
| February 2025 | 154.6 +17.6 |
| March 2025 | 135 -19.6 |
| Last 30 days | 133.7 -19.9 |