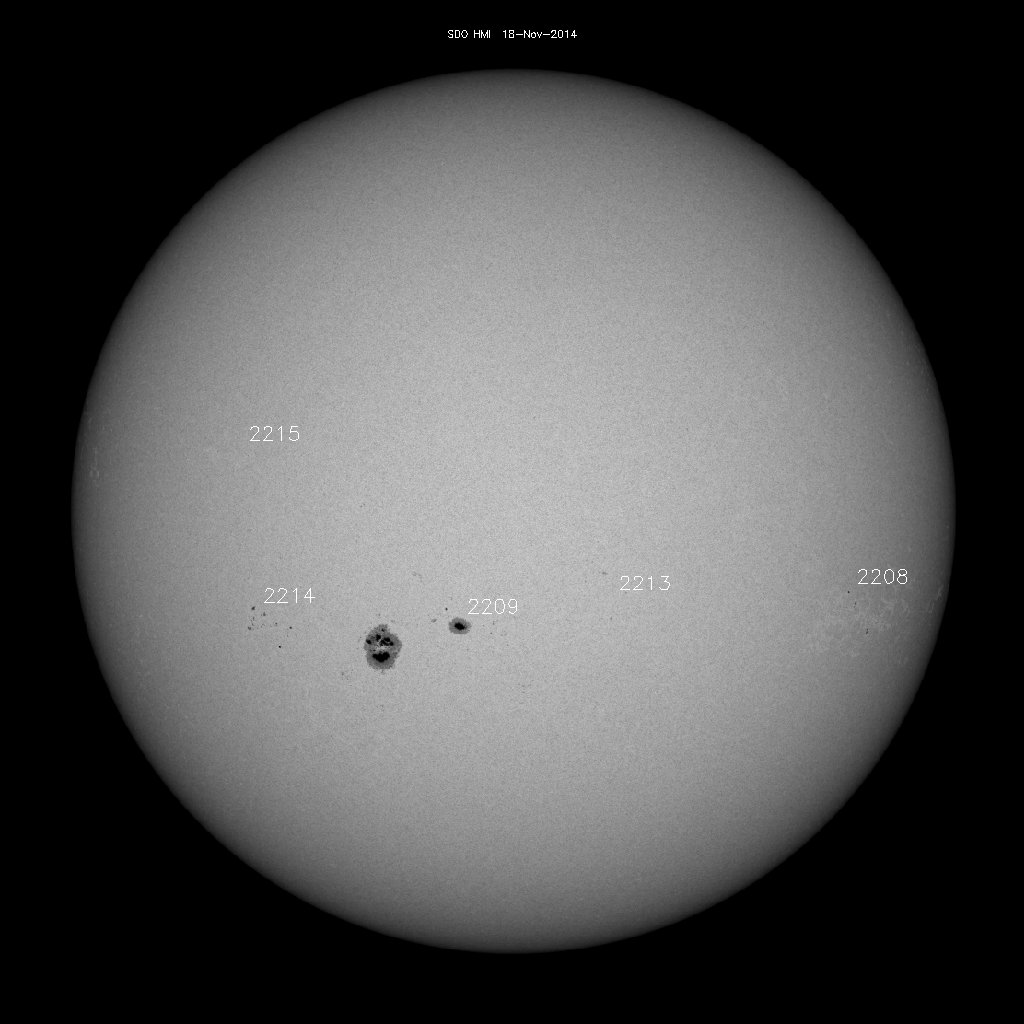
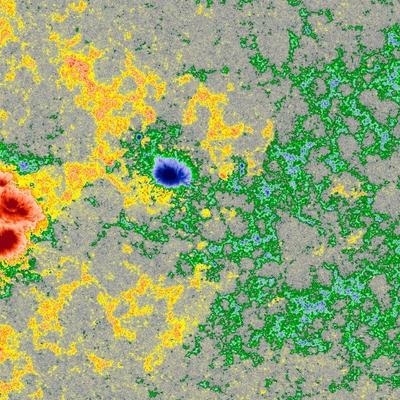
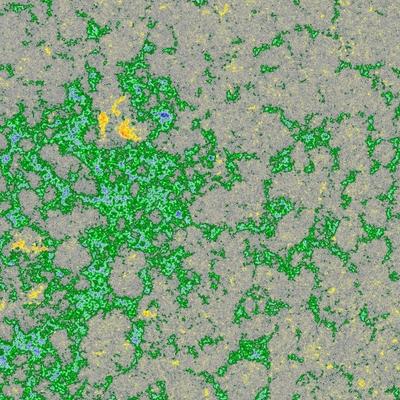
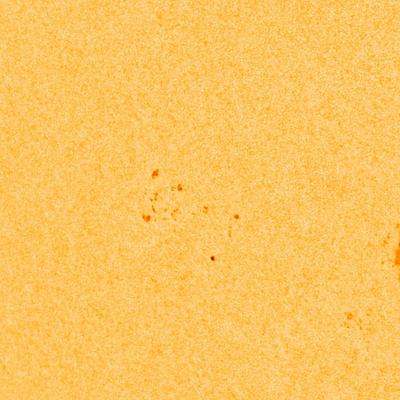
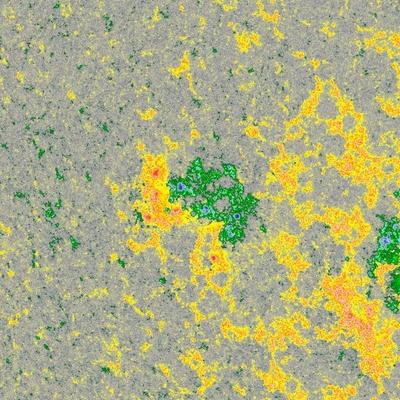
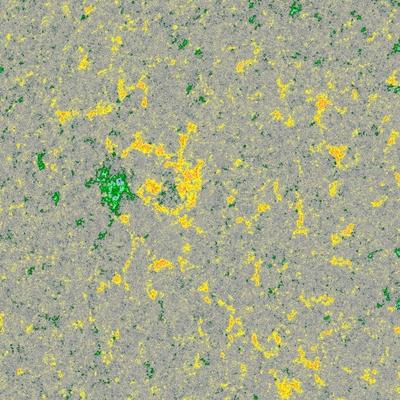
Viewing archive of Tuesday, 18 November 2014 - Sunspot regions
Courtesy of SDO, SOHO (NASA) and the [AIA, EVE, and/or HMI] consortium.
| Sunspot number | New regions | Background flux | Maximum flux | C |
|---|---|---|---|---|
| 92 -3 | 0 -1 | C1.27 | C2.76 | 1 |
Sunspot regions
Region 12205 |
||||
|---|---|---|---|---|
| Number of sunspots |
Size | Class Magn. | Class Spot | Location |
| 1 | 30 | HSX | N15W0* | |
Region 12208 |
||||
|---|---|---|---|---|
| Number of sunspots |
Size | Class Magn. | Class Spot | Location |
| 6 2 | 10 | BXO | S10W40 | |
|
||||
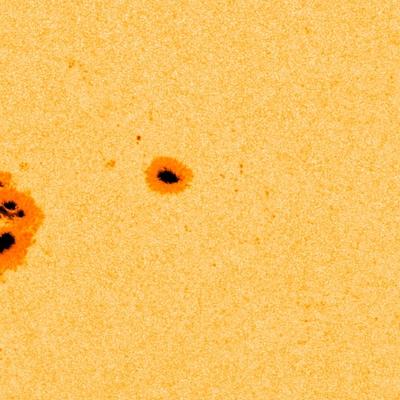
Region 12209 |
||||
|---|---|---|---|---|
| Number of sunspots |
Size | Class Magn. | Class Spot | Location |
| 22 -1 | 990 50 | FKC | S13E18 | |
|
||||
Solar flares on this day | ||||
| C2.64 | ||||
Region 12213 |
||||
|---|---|---|---|---|
| Number of sunspots |
Size | Class Magn. | Class Spot | Location |
| 12 3 | 30 -10 | CRO | S10W02 | |
|
||||
Region 12214 |
||||
|---|---|---|---|---|
| Number of sunspots |
Size | Class Magn. | Class Spot | Location |
| 4 | 10 -10 | BXO | S12E47 | |
|
||||
Region 12215 |
||||
|---|---|---|---|---|
| Number of sunspots |
Size | Class Magn. | Class Spot | Location |
| 1 | 10 | AXX | N09E49 | |
|
||||
All times in UTC
Latest news

Tuesday, 15 April 2025
CME arrival, G3 storm watch
Friday, 28 March 2025
X1.1 solar flare

Monday, 24 March 2025
Coronal hole faces Earth
Latest forum messages
AR 4055 108Ask your obscure/"stupid" space weather questions. 372Incoming & Unnumbered Active Regions 1800Filaments and prominences 86JHelioviewer Tips and Settings 27
More topicsSupport SpaceWeatherLive.com!
A lot of people come to SpaceWeatherLive to follow the Sun's activity or if there is aurora to be seen, but with more traffic comes higher server costs. Consider a donation if you enjoy SpaceWeatherLive so we can keep the website online!

Latest alerts
Tuesday, 22 April 2025
11:09 UTC - Solar flare
Moderate M1.35 flare
10:39 UTC - Radio Blackout
Minor R1 radio blackout in progress (≥M1 - current: M1.03)
Monday, 21 April 2025
20:45 UTC - Geomagnetic activity
Minor G1 geomagnetic storm (Kp5) Threshold Reached: 20:33 UTC

18:57 UTC - Solar flare
Moderate M1.99 flare
18:39 UTC - Radio Blackout
Minor R1 radio blackout in progress (≥M1 - current: M1.93)
Space weather facts
| Last X-flare | 2025/03/28 | X1.1 |
| Last M-flare | 2025/04/22 | M1.3 |
| Last geomagnetic storm | 2025/04/21 | Kp5+ (G1) |
| Spotless days | |
|---|---|
| Last spotless day | 2022/06/08 |
| Monthly mean Sunspot Number | |
|---|---|
| March 2025 | 134.2 -20.4 |
| April 2025 | 120 -14.2 |
| Last 30 days | 112 -28.2 |