Viewing archive of Wednesday, 12 June 2024
Solar activity report
Report of Solar-Geophysical Activity 2024 Jun 12 2200 UTCPrepared by the NOAA © SWPC and processed by SpaceWeatherLive.com
Joint USAF/NOAA Report of Solar and Geophysical Activity
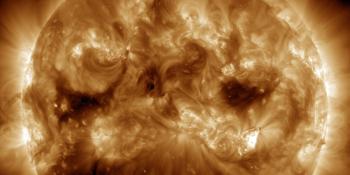
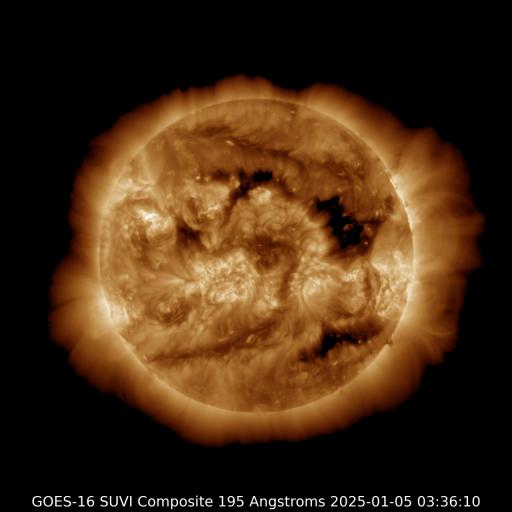
SDF Number 164 Issued at 2200Z on 12 Jun 2024IA. Analysis of Solar Active Regions and Activity from 11-2100Z to 12-2100Z
IB. Solar Activity Forecast
IIA. Geophysical Activity Summary 11-2100Z to 12-2100Z
IIB. Geophysical Activity Forecast
III. Event Probabilities 13 Jun to 15 Jun
| Class M | 40% | 40% | 40% |
| Class X | 05% | 05% | 05% |
| Proton | 20% | 10% | 01% |
| PCAF | green | ||
IV. Penticton 10.7 cm Flux
  Observed       12 Jun 165
  Predicted   13 Jun-15 Jun 165/160/155
  90 Day Mean        12 Jun 175
V. Geomagnetic A Indices
  Observed Afr/Ap 11 Jun  013/013
  Estimated     Afr/Ap 12 Jun  005/006
  Predicted    Afr/Ap 13 Jun-15 Jun  005/005-006/005-005/005
VI. Geomagnetic Activity Probabilities 13 Jun to 15 Jun
| A. Middle Latitudes | |||
|---|---|---|---|
| Active | 10% | 10% | 10% |
| Minor storm | 01% | 01% | 01% |
| Major-severe storm | 01% | 01% | 01% |
| B. High Latitudes | |||
|---|---|---|---|
| Active | 15% | 15% | 15% |
| Minor storm | 20% | 20% | 20% |
| Major-severe storm | 20% | 20% | 20% |
All times in UTC
Current data suggests there is a slight possibility for aurora to appear at the following high latitude regions in the near future
Sodankylä, UtsjokiReykjavik
Kirkenes, Tromsø
Murmansk
Kiruna
Latest news

Coronal hole faces Earth
Strong G3 geomagnetic storm watch for 23 March

Coronal hole faces Earth
Latest forum messages
Support SpaceWeatherLive.com!
A lot of people come to SpaceWeatherLive to follow the Sun's activity or if there is aurora to be seen, but with more traffic comes higher server costs. Consider a donation if you enjoy SpaceWeatherLive so we can keep the website online!

Latest alerts
Coronal hole faces Earth
The anticipated strong G3 geomagnetic storm watch never materialized as the coronal mass ejection that was supposed to arrive early yesterday didn't arrive until today just past midnight UTC. The impact was very lackluster with the Bt (total strength of the IMF) increasing to a moderate 15nT at best and the solar wind speed reaching just 420km/s. A far cry from the anticipated 700 to 800km/s. That once again goes to show how hard it is to forecast space weather events and any resulting geomagnetic conditions. We remain under the influence of the CME and high latitude sky watchers should remain alert for some nice aurora displays but middle latitude sky watchers will probably have to wait for the next opportunity.
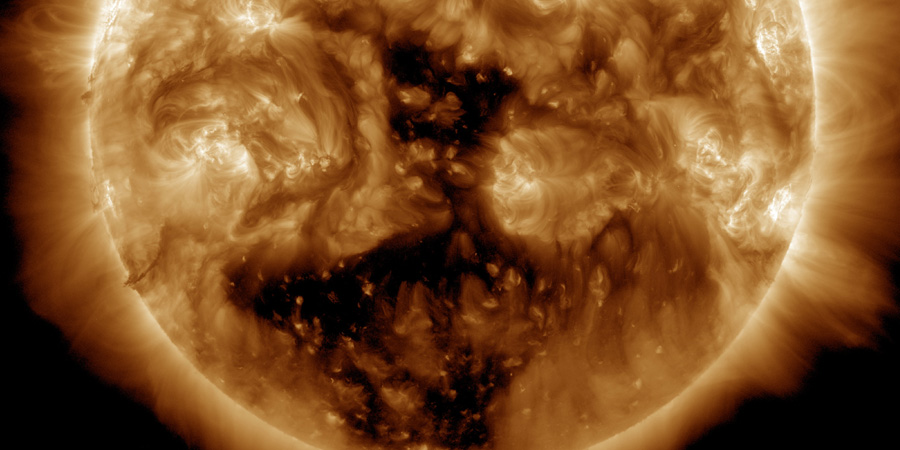
13:55 UTC - Coronal hole
A transequatorial coronal hole is facing Earth. Enhanced solar wind could arrive in ~3 days
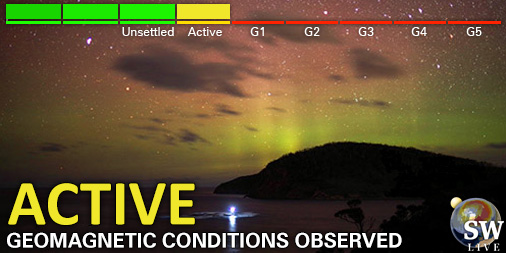
02:45 UTC - Geomagnetic activity
Active geomagnetic conditions (Kp4) Threshold Reached: 02:33 UTC
Saturday, 22 March 2025
23:45 UTC - Geomagnetic activity
Minor G1 geomagnetic storm (Kp5) Threshold Reached: 23:37 UTC

Space weather facts
| Last X-flare | 2025/02/23 | X2.0 |
| Last M-flare | 2025/03/21 | M1.2 |
| Last geomagnetic storm | 2025/03/22 | Kp6- (G2) |
| Spotless days | |
|---|---|
| Last spotless day | 2022/06/08 |
| Monthly mean Sunspot Number | |
|---|---|
| February 2025 | 154.6 +17.6 |
| March 2025 | 140.6 -14 |
| Last 30 days | 138.7 -14.7 |