Viewing archive of Friday, 13 November 2015
Solar activity report
Prepared by the NOAA © SWPC and processed by SpaceWeatherLive.com
Joint USAF/NOAA Report of Solar and Geophysical Activity
SDF Number 317 Issued at 2200Z on 13 Nov 2015IA. Analysis of Solar Active Regions and Activity from 12-2100Z to 13-2100Z
IB. Solar Activity Forecast
IIA. Geophysical Activity Summary 12-2100Z to 13-2100Z
IIB. Geophysical Activity Forecast
III. Event Probabilities 14 Nov to 16 Nov
| Class M | 01% | 01% | 01% |
| Class X | 01% | 01% | 01% |
| Proton | 01% | 01% | 01% |
| PCAF | green | ||
IV. Penticton 10.7 cm Flux
  Observed       13 Nov 103
  Predicted   14 Nov-16 Nov 105/105/100
  90 Day Mean        13 Nov 105
V. Geomagnetic A Indices
  Observed Afr/Ap 12 Nov  004/003
  Estimated     Afr/Ap 13 Nov  013/015
  Predicted    Afr/Ap 14 Nov-16 Nov  017/022-011/012-007/008
VI. Geomagnetic Activity Probabilities 14 Nov to 16 Nov
| A. Middle Latitudes | |||
|---|---|---|---|
| Active | 40% | 30% | 15% |
| Minor storm | 20% | 10% | 05% |
| Major-severe storm | 01% | 01% | 01% |
| B. High Latitudes | |||
|---|---|---|---|
| Active | 10% | 15% | 20% |
| Minor storm | 30% | 30% | 30% |
| Major-severe storm | 55% | 40% | 20% |
All times in UTC
Current data suggests there is a moderate possibility for aurora to appear at the following high latitude regions in the near future
Gillam, MB, Yellowknife, NTCurrent data suggests there is a slight possibility for aurora to appear at the following high latitude regions in the near future
Edmonton, AB, Iqaluit, NU, Saskatoon, SKNuuk
Reykjavik
Latest news
X1.1 solar flare

Coronal hole faces Earth
Strong G3 geomagnetic storm watch for 23 March
Latest forum messages
More topicsSupport SpaceWeatherLive.com!
A lot of people come to SpaceWeatherLive to follow the Sun's activity or if there is aurora to be seen, but with more traffic comes higher server costs. Consider a donation if you enjoy SpaceWeatherLive so we can keep the website online!

Latest alerts
04:03 UTC - Hemispheric Power Index
The OVATION model predicts the Hemispheric Power Index to reach 50GW at 04:56 UTC
01:45 UTC - Geomagnetic activity
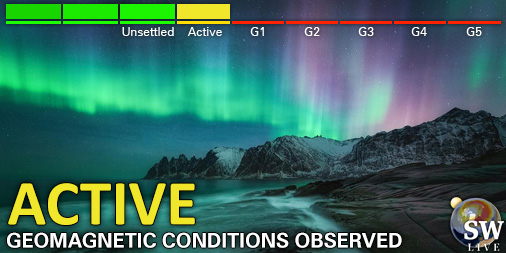
Active geomagnetic conditions (Kp4) Threshold Reached: 01:32 UTC
Tuesday, 1 April 2025
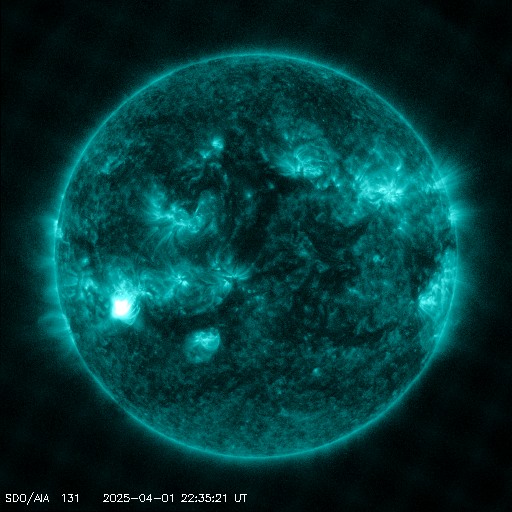
22:51 UTC - Solar flare
Moderate M2.5 flare
22:30 UTC - Radio Blackout
Minor R1 radio blackout in progress (≥M1 - current: M1.45)
07:15 UTC - 10cm Radio Burst
Begin Time: 01/04/2025 06:45 UTC Maximum Time: 01/04/2025 06:45 UTC Duration: 1 minutes. Peak flux: 190 sfu
Space weather facts
| Last X-flare | 2025/03/28 | X1.1 |
| Last M-flare | 2025/04/01 | M2.4 |
| Last geomagnetic storm | 2025/03/27 | Kp5 (G1) |
| Spotless days | |
|---|---|
| Last spotless day | 2022/06/08 |
| Monthly mean Sunspot Number | |
|---|---|
| February 2025 | 154.6 +17.6 |
| April 2025 | 147 -7.6 |
| Last 30 days | 128.8 -21.8 |