Viewing archive of Wednesday, 30 December 2015
Solar activity report
Any mentioned solar flare in this report has a scaling factor applied by the Space Weather Prediction Center (SWPC). Because of the SWPC scaling factor, solar flares are reported as 42% smaller than for the science quality data. The scaling factor has been removed from our archived solar flare data to reflect the true physical units.
Report of Solar-Geophysical Activity 2015 Dec 30 2200 UTCPrepared by the NOAA © SWPC and processed by SpaceWeatherLive.com
Joint USAF/NOAA Report of Solar and Geophysical Activity
SDF Number 364 Issued at 2200Z on 30 Dec 2015IA. Analysis of Solar Active Regions and Activity from 29-2100Z to 30-2100Z
Solar activity has been at low levels for the past 24 hours.
The largest solar event of the period was a C1 event observed at
30/1905Z from Region 2473 (S21W47). There are currently 2 numbered
sunspot regions on the disk.
IB. Solar Activity Forecast
Solar activity is expected to be low with
a chance for M-class flares on days one, two, and three (31 Dec, 01 Jan,
02 Jan).
IIA. Geophysical Activity Summary 29-2100Z to 30-2100Z
The geomagnetic
field has been at quiet levels for the past 24 hours. Solar wind speed,
as measured by the ACE spacecraft, reached a peak speed of 398 km/s at
30/0038Z. Total IMF reached 5 nT at 30/1819Z. The maximum southward
component of Bz reached -4 nT at 29/2106Z. Electrons greater than 2 MeV
at geosynchronous orbit reached a peak level of 1656 pfu.
IIB. Geophysical Activity Forecast
The geomagnetic field is expected
to be at unsettled to severe storm levels on day one (31 Dec), unsettled
to minor storm levels on day two (01 Jan) and unsettled to active levels
on day three (02 Jan). Protons have a slight chance of crossing
threshold on days one, two, and three (31 Dec, 01 Jan, 02 Jan).
III. Event Probabilities 31 Dec to 02 Jan
| Class M | 40% | 30% | 25% |
| Class X | 05% | 01% | 01% |
| Proton | 15% | 15% | 15% |
| PCAF | green | ||
IV. Penticton 10.7 cm Flux
  Observed       30 Dec 102
  Predicted   31 Dec-02 Jan 100/105/105
  90 Day Mean        30 Dec 109
V. Geomagnetic A Indices
  Observed Afr/Ap 29 Dec  004/004
  Estimated     Afr/Ap 30 Dec  008/017
  Predicted    Afr/Ap 31 Dec-02 Jan  028/046-020/024-015/018
VI. Geomagnetic Activity Probabilities 31 Dec to 02 Jan
| A. Middle Latitudes | |||
|---|---|---|---|
| Active | 15% | 45% | 40% |
| Minor storm | 35% | 25% | 20% |
| Major-severe storm | 50% | 05% | 05% |
| B. High Latitudes | |||
|---|---|---|---|
| Active | 01% | 05% | 10% |
| Minor storm | 10% | 25% | 25% |
| Major-severe storm | 90% | 65% | 60% |
All times in UTC
Current data suggests there is a slight possibility for aurora to appear at the following high latitude regions in the near future
Norilsk, VorkutaLatest news
Friday, 28 March 2025
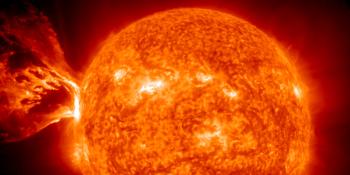
X1.1 solar flare

Monday, 24 March 2025
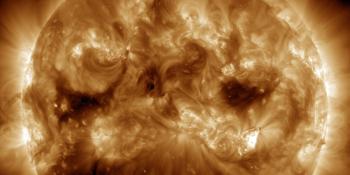
Coronal hole faces Earth
Saturday, 22 March 2025
Strong G3 geomagnetic storm watch for 23 March
Latest forum messages
Incoming & Unnumbered Active Regions 1677AR4048 126New satellites - Proba-3, PUNCH, SWFO-L1, GOES-U/19 47AR 4054 21Unspecified geomagnetic activity 2229
More topicsSupport SpaceWeatherLive.com!
A lot of people come to SpaceWeatherLive to follow the Sun's activity or if there is aurora to be seen, but with more traffic comes higher server costs. Consider a donation if you enjoy SpaceWeatherLive so we can keep the website online!

Latest alerts
15:15 UTC - Geomagnetic activity
Minor G1 geomagnetic storm (Kp5) Threshold Reached: 14:59 UTC

06:30 UTC - Type II Radio Emission
Begin Time: 08/04/2025 05:53 UTC Estimated Velocity: 456km/sec.
05:15 UTC - Hemispheric Power Index
The OVATION model predicts the Hemispheric Power Index to reach 50GW at 06:02 UTC
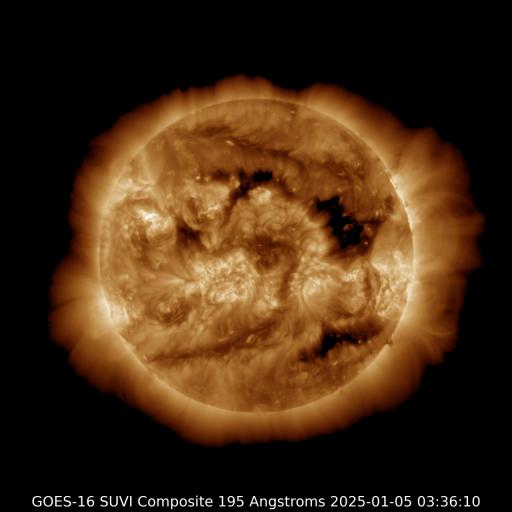
00:55 UTC - Coronal hole
A southern hemisphere coronal hole is facing Earth. Enhanced solar wind could arrive in ~3 days
Monday, 7 April 2025
20:45 UTC - Geomagnetic activity
Active geomagnetic conditions (Kp4) Threshold Reached: 20:39 UTC

Space weather facts
| Last X-flare | 2025/03/28 | X1.1 |
| Last M-flare | 2025/04/05 | M1.0 |
| Last geomagnetic storm | 2025/04/06 | Kp5 (G1) |
| Spotless days | |
|---|---|
| Last spotless day | 2022/06/08 |
| Monthly mean Sunspot Number | |
|---|---|
| March 2025 | 134.2 -20.4 |
| April 2025 | 151.3 +17.1 |
| Last 30 days | 135.2 -4.5 |