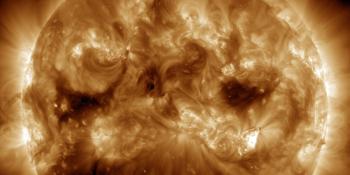
Viewing archive of Monday, 3 April 2017
Geophysical report
Any mentioned solar flare in this report has a scaling factor applied by the Space Weather Prediction Center (SWPC). Because of the SWPC scaling factor, solar flares are reported as 42% smaller than for the science quality data. The scaling factor has been removed from our archived solar flare data to reflect the true physical units.
Solar and Geophysical Activity Summary 2017 Apr 03 0245 UTCPrepared by the NOAA © SWPC and processed by SpaceWeatherLive.com
Joint USAF/NOAA Solar and Geophysical Activity Summary
SGAS Number 093 Issued at 0245Z on 03 Apr 2017 This report is compiled from data received at SWO on 02 AprA. Energetic Events
Begin  Max  End  Rgn   Loc   Xray  Op 245MHz 10cm   Sweep
 0026 0029 0031  2644        B4.8     1100
 0038 0038 0038                       140
 0206 0210 0213  2645        C1.0     2800             IV
 0241 0246 0248  2645 S12W08 C8.0  Sn 250
 0750 0802 0813  2644 N12W59 M5.3  2n 100           II/IV
 0841 0841 0842                       140
 1126      1703                                        IV
 1141 1141 1141                       150
 1252 1300 1311  2644        M2.3
 1416 1418 1423  2645 S12W14       Sf 970
 1431 1432 1432                       170
 1437 1437 1437                       100
 1520 1520 1520                       150
 1620 1627 1638  2644 N14W66 C3.0  Sf 160
 1656 1656 1656                       150
 1733 1733 1733                       120
 1818 1838 1928  2644 N16W68 M2.1  Sf 230
 1930 1930 1930                       100
 2006 2006 2006                       100
 2026 2033 2038  2644        M5.7     670
 2042 2042 2042                       150
 2045 2045 2045                       100
B. Proton Events
None
C. Geomagnetic Activity Summary
Quiet to Unsettled
D. Stratwarm
Not available
E. Daily Indices: (real-time preliminary/estimated values)
10 cm 112  SSN 075  Afr/Ap 006/006   X-ray Background B7.9
Daily Proton Fluence (flux accumulation over 24 hrs)
GT 1 MeV 8.0e+06   GT 10 MeV 1.4e+04 p/(cm2-ster-day)
(GOES-13 satellite synchronous orbit W75 degrees)
Daily Electron Fluence
GT 2 MeV 2.30e+09 e/(cm2-ster-day)
(GOES-13 satellite synchronous orbit W75 degrees)
3 Hour K-indices
Boulder 1 3 3 1 2 3 2 0 Planetary 2 2 2 1 2 2 1 1
F. Comments
  The greater than 2 MeV electron fluence reached very
high levels on 02 April 2017
All times in UTC
Latest news
Latest forum messages
AR4046 136AR4048 35Solar Demon 3Unspecified geomagnetic activity 2146Aurora photography hints for those of us with smartphones 54
More topicsSupport SpaceWeatherLive.com!
A lot of people come to SpaceWeatherLive to follow the Sun's activity or if there is aurora to be seen, but with more traffic comes higher server costs. Consider a donation if you enjoy SpaceWeatherLive so we can keep the website online!

Space weather facts
| Last X-flare | 2025/03/28 | X1.1 |
| Last M-flare | 2025/03/30 | M1.0 |
| Last geomagnetic storm | 2025/03/27 | Kp5 (G1) |
| Spotless days | |
|---|---|
| Last spotless day | 2022/06/08 |
| Monthly mean Sunspot Number | |
|---|---|
| February 2025 | 154.6 +17.6 |
| March 2025 | 127 -27.6 |
| Last 30 days | 127 -25.7 |


