Viewing archive of Wednesday, 22 June 2022 - Sunspot regions
Courtesy of SDO, SOHO (NASA) and the [MDI, AIA, EVE, and/or HMI] consortium.
| Sunspot number | New regions | Background flux | Maximum flux | C |
|---|---|---|---|---|
| 80 -24 | 0 -1 | B7.89 | C3.56 | 17 |
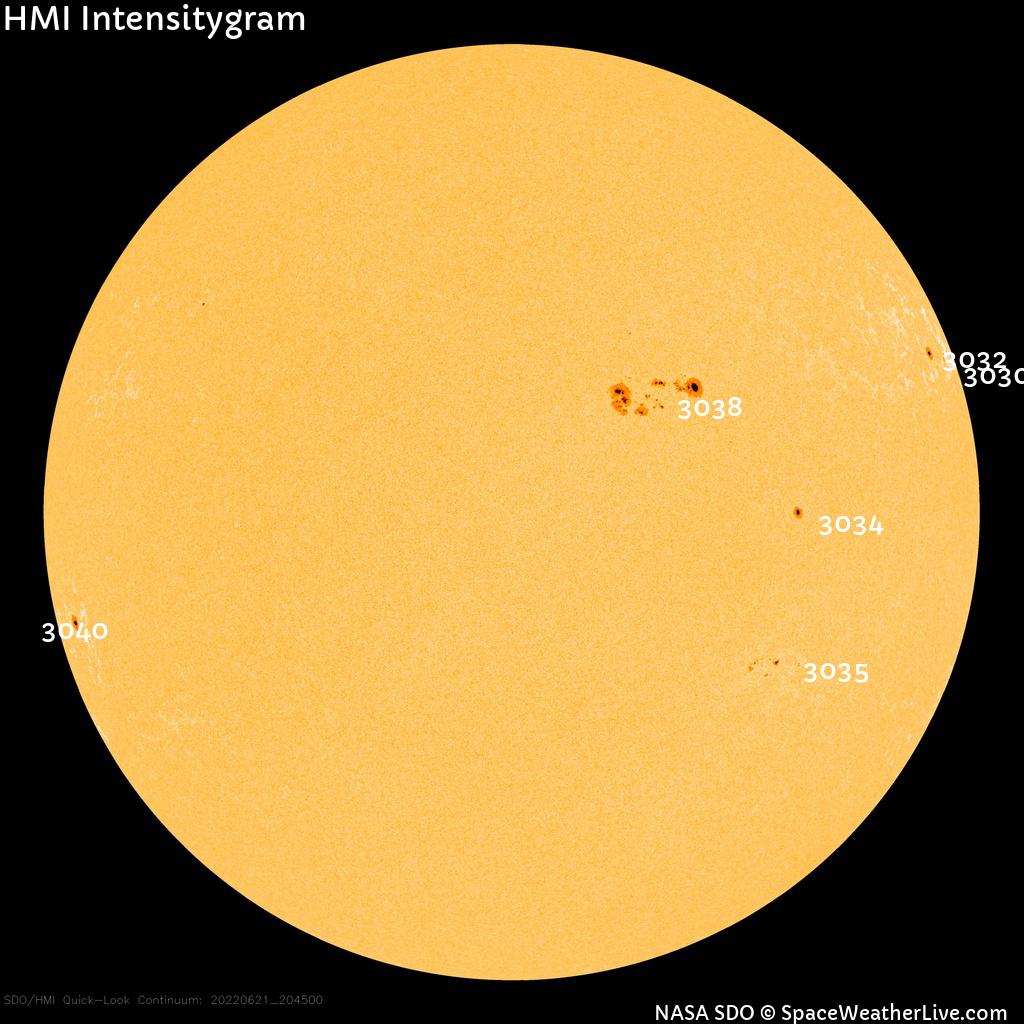
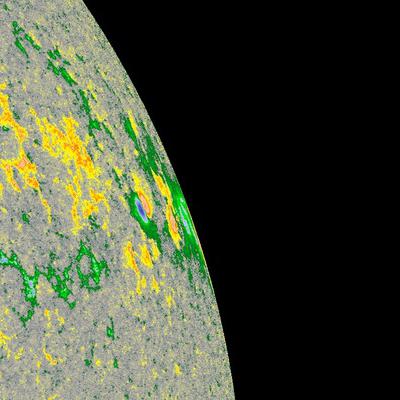
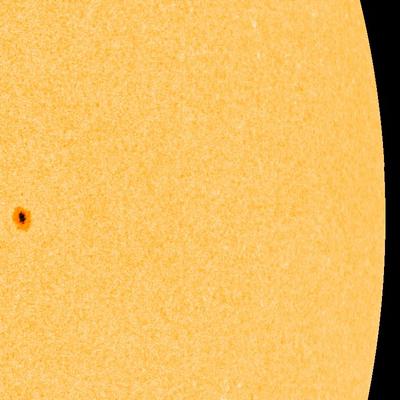
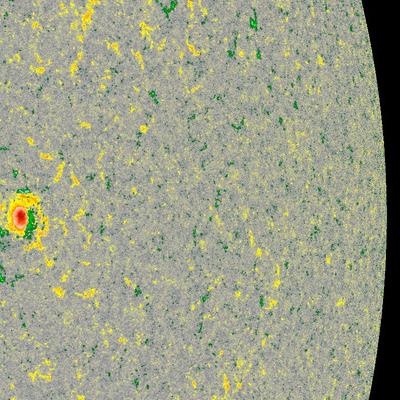
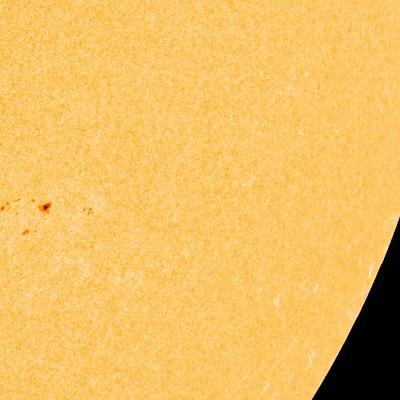
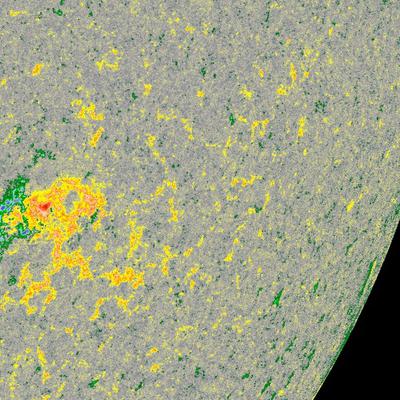
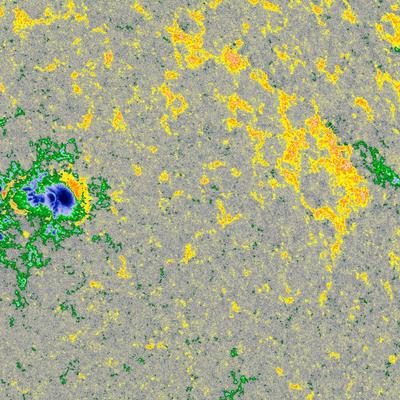
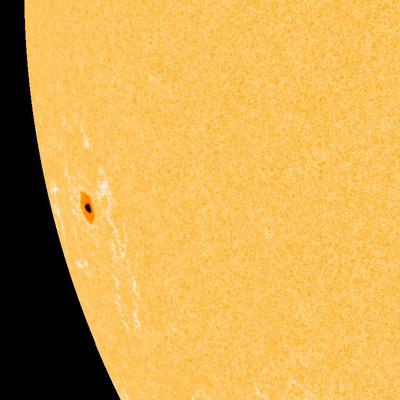
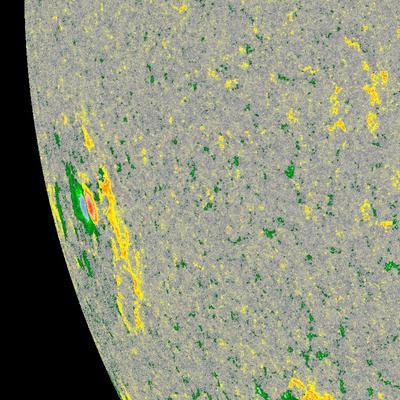
Sunspot regions
Region 13030 |
||||
|---|---|---|---|---|
| Number of sunspots |
Size | Class Magn. | Class Spot | Location |
| 4 | 220 | DAI | N18W98 | |
|
||||
Region 13032 |
||||
|---|---|---|---|---|
| Number of sunspots |
Size | Class Magn. | Class Spot | Location |
| 1 | 50 -50 | HSX | N20W88 | |
|
||||
Region 13034 |
||||
|---|---|---|---|---|
| Number of sunspots |
Size | Class Magn. | Class Spot | Location |
| 1 | 50 -10 | HSX | N01W53 | |
|
||||
Region 13035 |
||||
|---|---|---|---|---|
| Number of sunspots |
Size | Class Magn. | Class Spot | Location |
| 4 | 50 40 | DSO | S18W50 | |
|
||||
Region 13038 |
||||
|---|---|---|---|---|
| Number of sunspots |
Size | Class Magn. | Class Spot | Location |
| 21 -12 | 480 50 | EKI | N15W34 | |

|
||||
Solar flares on this day | ||||
| C1.9 C1.9 C1.7 C1.6 C1.2 C1.1 C1.3 C1.3 C1.7 C3.3 C1.1 C1.5 C3.6 | ||||
Region 13040 |
||||
|---|---|---|---|---|
| Number of sunspots |
Size | Class Magn. | Class Spot | Location |
| 3 2 | 160 100 | CSO | S70E03 | |
|
||||
Solar flares on this day | ||||
| C2.9 C2.7 C1.8 | ||||
All times in UTC
Latest news
Tuesday, 15 April 2025
CME arrival, G3 storm watch
Friday, 28 March 2025
X1.1 solar flare

Monday, 24 March 2025
Coronal hole faces Earth
Latest forum messages
Ask your obscure/"stupid" space weather questions. 376AR4064 29Filaments and prominences 106AR 4055 115Line chart of indicators on the auror video, animated graph trace 26
More topicsSupport SpaceWeatherLive.com!
A lot of people come to SpaceWeatherLive to follow the Sun's activity or if there is aurora to be seen, but with more traffic comes higher server costs. Consider a donation if you enjoy SpaceWeatherLive so we can keep the website online!

Latest alerts
07:27 UTC - Hemispheric Power Index
The OVATION model predicts the Hemispheric Power Index to reach 50GW at 08:15 UTC
07:15 UTC - Geomagnetic activity
Active geomagnetic conditions (Kp4) Threshold Reached: 07:03 UTC

06:27 UTC - Coronal mass ejection arrival
CME impact detected - Current Solar Wind Speed 644km/sec - IMF: Bt (strength): 15nT & Bz: 0nT (South).
Space weather facts
| Last X-flare | 2025/03/28 | X1.1 |
| Last M-flare | 2025/04/22 | M1.3 |
| Last geomagnetic storm | 2025/04/21 | Kp5+ (G1) |
| Spotless days | |
|---|---|
| Last spotless day | 2022/06/08 |
| Monthly mean Sunspot Number | |
|---|---|
| March 2025 | 134.2 -20.4 |
| April 2025 | 121.5 -12.7 |
| Last 30 days | 116.5 -16.8 |